
This article written by Avery Louie gives a lot of inside information about testing the galvanic sensors used in rebreathers
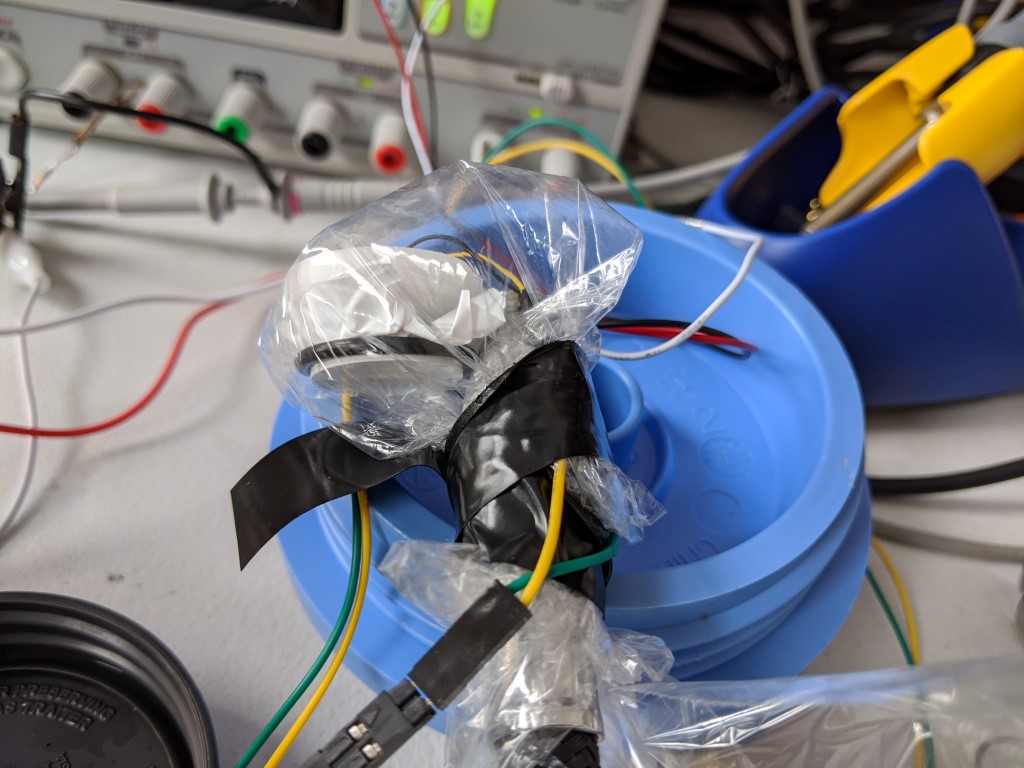
The Science Sr. doing what it does best
In the last post I alluded to a larger pressure pot- the Science Sr. This was totally based off of the $50 Cell Checker from the wreckless diver, which is based off of a now defunct post on some other website. I’ll do my best to document what I have made here, since its an awesome tool. I’ll put a standard disclaimer on building one of these- don’t do it, it could blowup, etc, and it could really kill you, and it might hurt the entire time.
WHY THIS COULD BE A BAD IDEA
The Science Sr. is based around an air filter canister. These are rated to 125 PSI…with water. they are 100% not for use with air as far as I can tell. Air, unlike water, is fairly compressible. That means if the amount of energy stored in pressurized air is huge compared to a hydraulic system at the same pressure. Filling this to 125 PSI might be fine, or it could explode due to some component being exposed to chemicals or because it has been cycled too many times or because it has been cycled too rapidly. Plastic will fatigue over time, and that will reduce the margin between exploding and not exploding.
Just like the wreckless diver, I have added an over pressure relief valve (OPV) to prevent going over ~45 PSI or so. This is not a guarantee that it will not go over 45 PSI- I have it hooked up to a scuba reg with an IP of ~120 PSI that can provide something like 100 SCFM (cubic feet/min of gas at some standard temp and pressure). That is fast enough to drain a typical AL80 scuba tank from 3000 PSI to 0 in under a minute. There is no guarantee that the OPV can keep up with this flow rate, so I am VERY careful operating the valve.
Also, in some kind of blue-moon case where my first stage reg goes haywire, its designed to fail open. This would be bad news because this will shoot tank pressure right out of all the low pressure hoses. In a dive situation this is great, because you have ~30s to breathe off a free flowing reg. In a pressure test situation this is bad, because up to 3000 psi (more for some tanks) will be shooting out of every reg and inflator hose, including the one stuck to the pressure tester, which will almost certainly explode it.
This was mitigated somewhat by testing with a mostly empty (500 PSI) tank, and by very careful control of the valve. For cell checking applications, it may be a good idea to fill this with water partially to reduce the amount of volume that is full of air, reducing the potential energy. Anyway, on to how to build it. SCIENCE SR. CONSTRUCTION
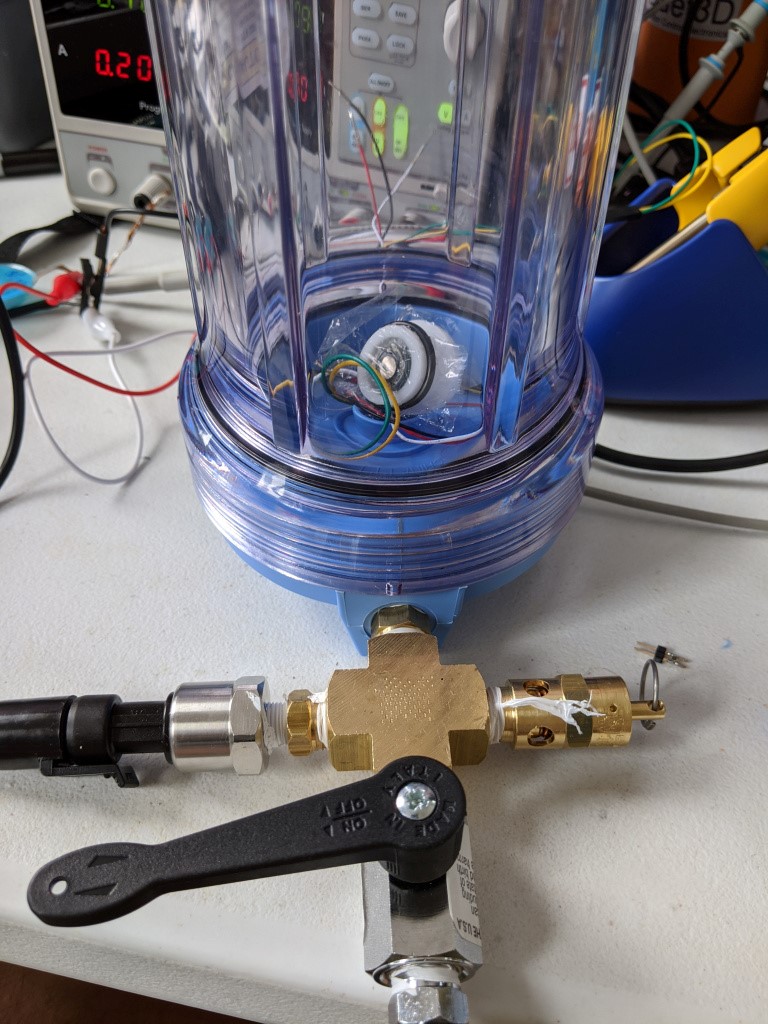
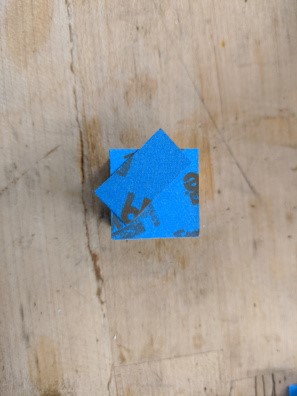
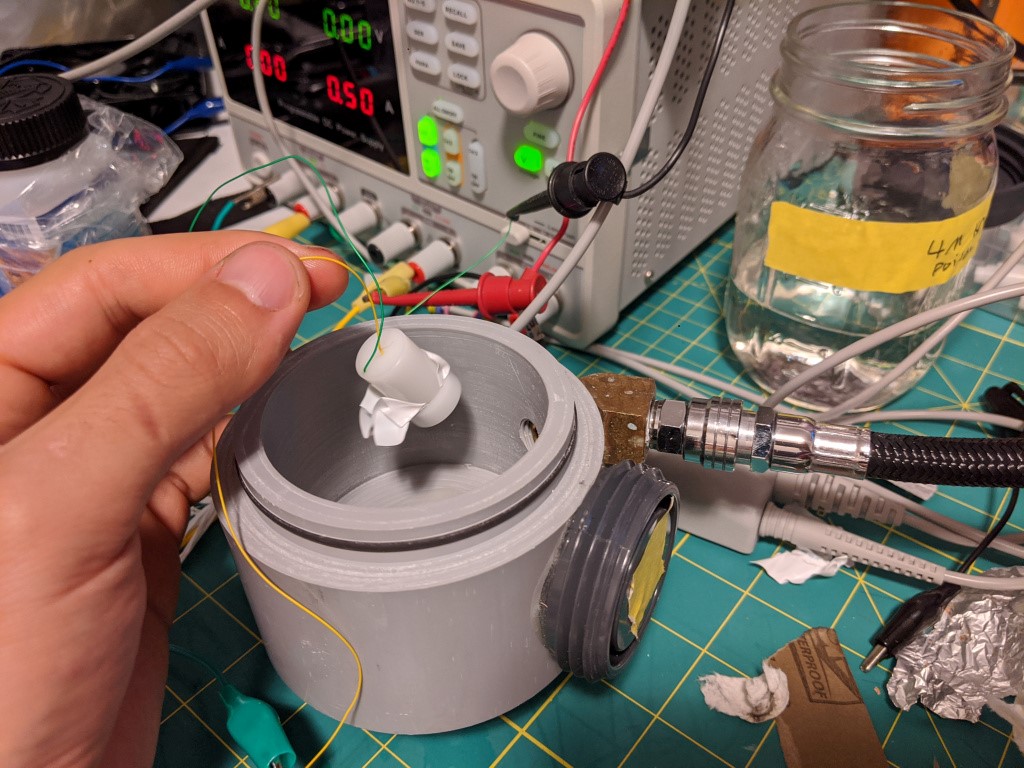
Science Sr. Assembly. Note notch/hole at 6 oclock on the blue part.
Here it is, in all its glory. On the top is basically a X manifold that houses all the important stuff. At 12 oclock is a NPT to BC hose adapter going into a ball valve. At 3 oclock is an 1/4-MPT to 1/8-FPT adapter and a 1/8 NPT pressure sensor. These are available on ebay and seem to work just fine. It seems like they are for some kind of automotive application based on the connectors, and they are available in a variety of ranges. At 6 oclock is a 1/4-MPT – 14-MPT adapter. This attaches the female pipe thread cross fitting to the female pipe thread of the canister head. At 9 oclock is a 1/4-MPT 45 PSI overpressure valve.
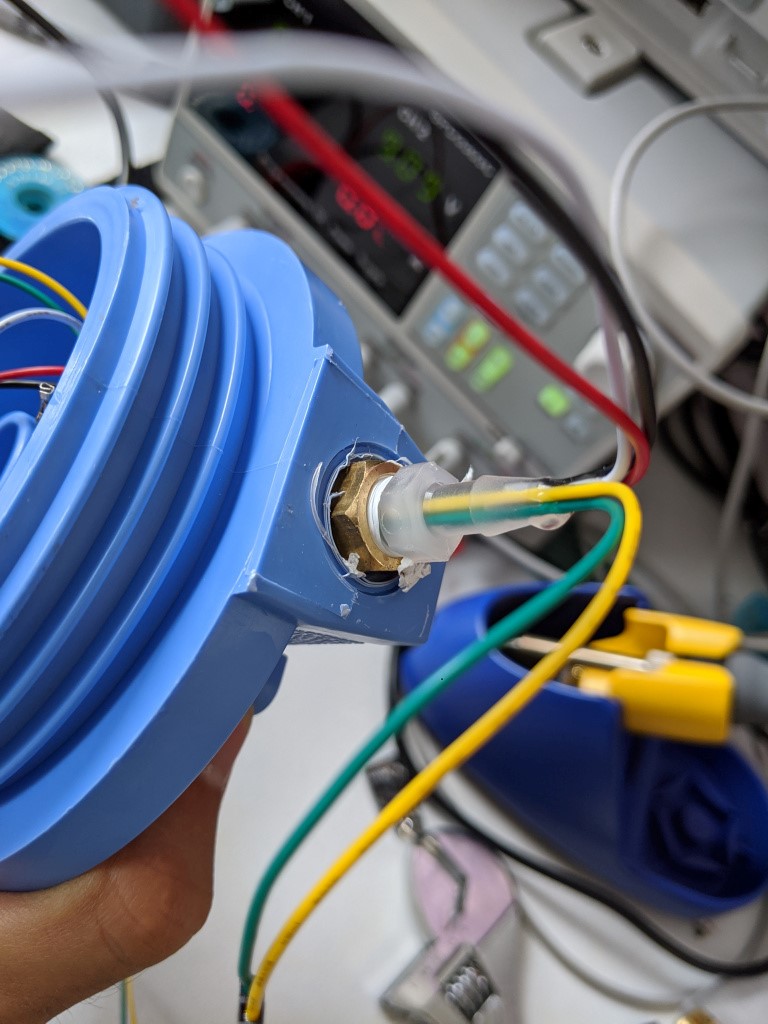
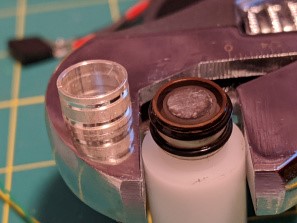
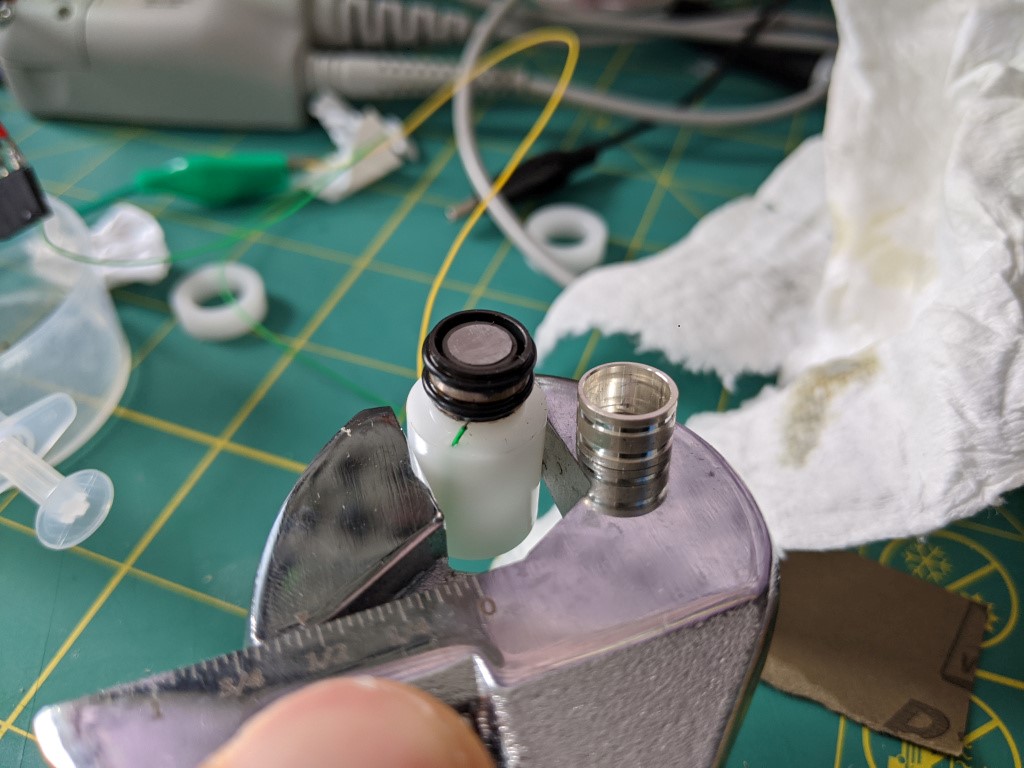
Close up of epoxy job
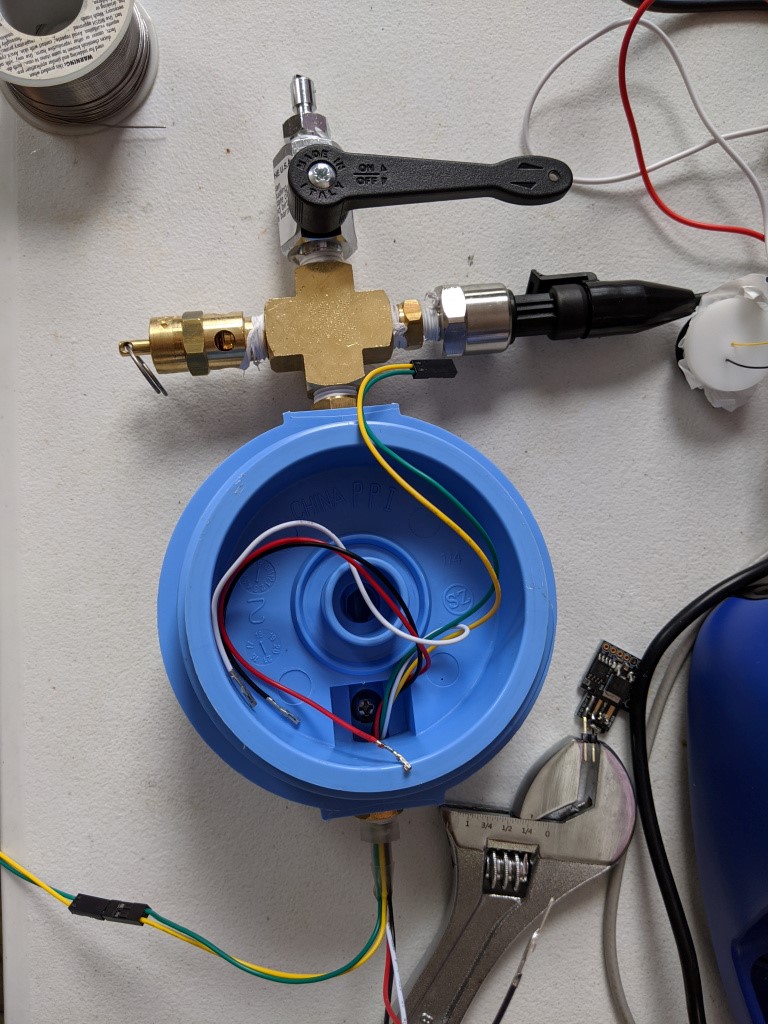
On the other end is a 1/4″ MPT- 1/8″ FPT adapter. The threads on the filter are one-time-use soft plastic NPTs, so I essentially “replaced” them with a metal 1/8″ npt. Screwed into this is a 1/8 MPT to hose barb adapter with a bunch of wires epoxied to it, creating an airtight pass through. I like the 60 second epoxies that have narrow mixing nozzles for this, because they cure FAST and the nozzle fits into the fitting well. However, they are expensive and usually only come with two nozzles, which is wasteful if you only use a few ml per fitting. Silicone seems to work ok for this, but its probably best to apply with some kind of syringe. While none of these fittings have shot out the epoxy/silicone plug yet, it is probably best to get as much plug in as possible, especially on the inside of the plug. This should create a step in the plug to make it much stronger.
It is important to install this on the side labeled IN, since there is a large pass through there, and the wires will be much easier to pull into the canister body (see the assembly picture above).
Here is a shopping list:
- 45 PSI OPV, mcmaster 48435K72
- Ball valve, mcmaster 4912K82
- HP brass pipe fitting, mcmaster 50785K233
- 2x NPT reducers, mcmaster 50785K61*
- 1x 1/8 npt to barb, mcmaster 5117K96*
- DGX bc hose to NPT
- Pentek 158117 (amazon or other)
*I had these on hand but this mcmaster part should be equivalent
TESTING AND RESULTS
After some initial testing, it seemed like I would need to return to the teflon tape as a membrane to get good sensor response. I suspect this will let electrolyte evaporate out over time (based on previous experience), but it does give a very satisfactory response time, and over short periods the sensor is serviceable enough. It was necessary to make the sensor up in the electrolyte to eliminate bubbles. This meant pouring the eletrolyte into a dish and then wearing gloves to assemble the sensor “underwater”. Excess KOH was washed off.
As a note- for this exact size of sensor, a ~510 ohm resistor seemed “right”. More discussion of that below. STEP RESPONSE
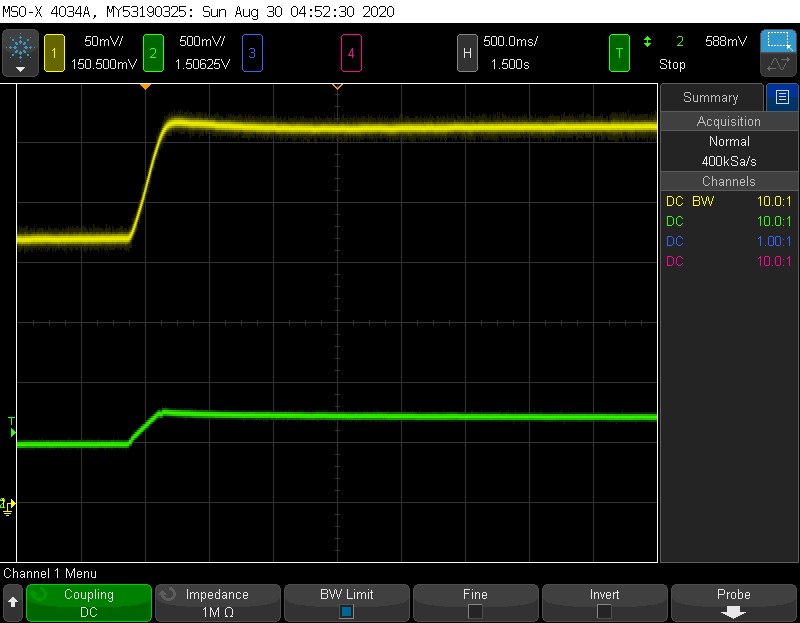
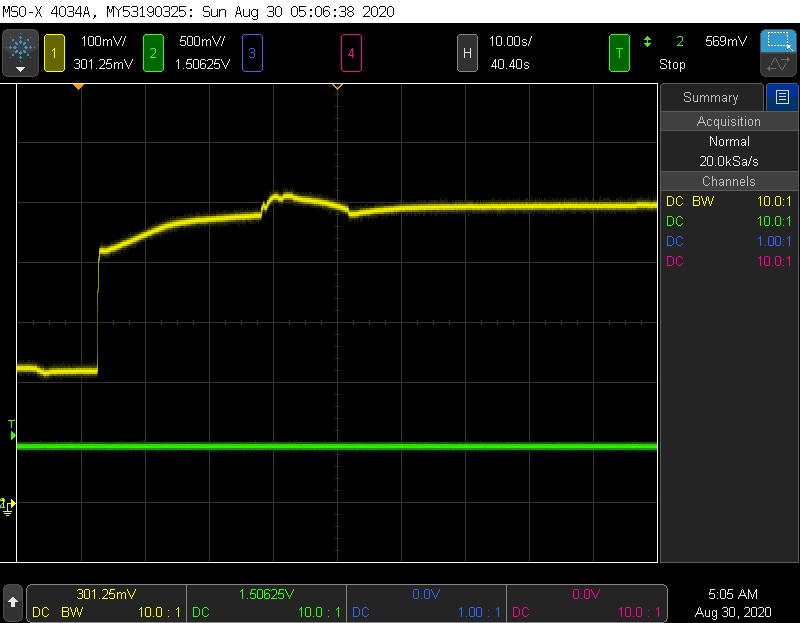
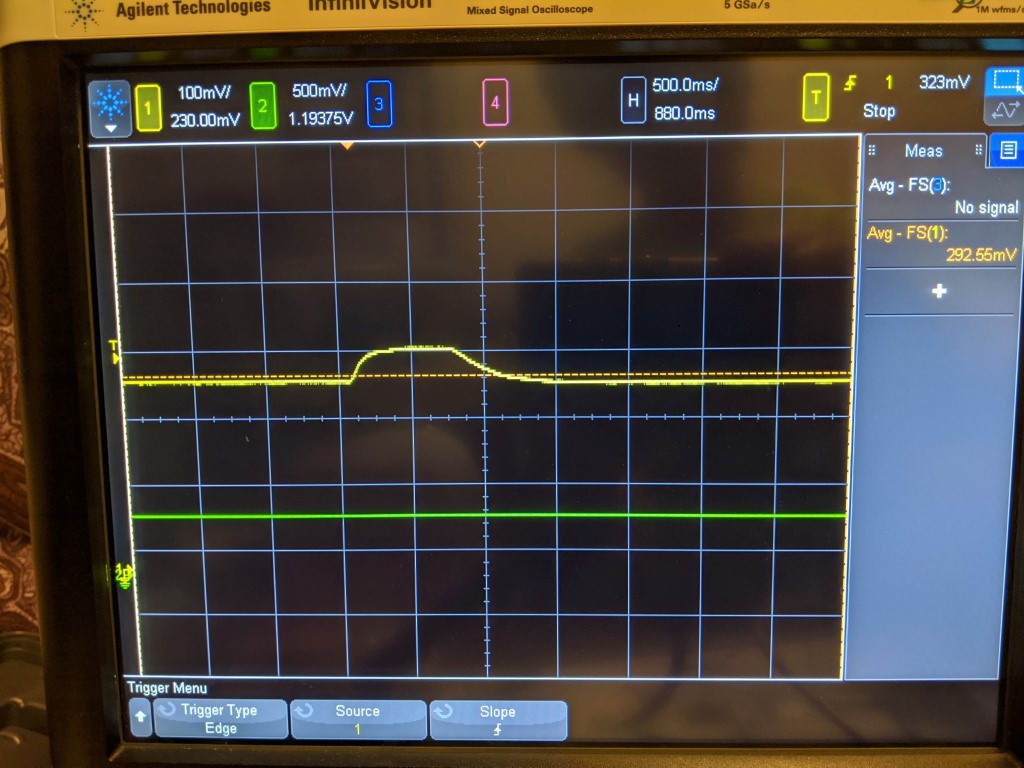
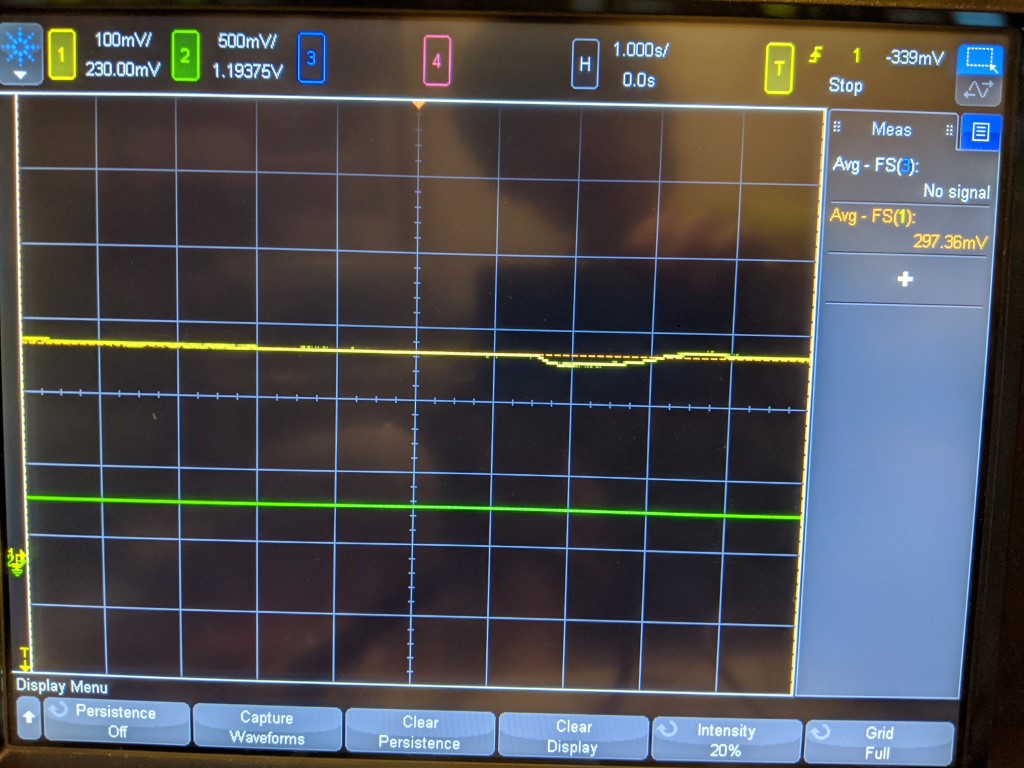
Yellow = sensor, Green = Pressure. 500mV = 1ATM
Here is an example of the step response to pressure. With the ball valve, its a little nerve wracking to throw it fully open, and I wasnt keen on testing the opv, so the pressure step here actually has a rise time of ~250 ms. The rise time of the sensor is about the same- It does not seem like this step is fast enough to elicit any kind of delay in the sensor. The pressure here goes from 1 ATM to 1.5 ATM, and the sensor rises from ~220 mV to 325 mV, which is what we would expect.
The next test was to wrap the sensor up in a bag with the inflator hose, and to shoot O2 straight into it. This should give a value for 100% O2 at 1 ATA.
Yellow = sensor
I wasnt sure how much O2 to squeeze in there or where it was really saturating, so there is a little bump in the middle as I jostled the sensor. But after spewing out a good amount of gas, it looks like the maximum value is 500mV. This is an interesting result and shows that the sensor is actually no good up to 100% O2. If the sensor were linear, the resulting voltage should be 5x atmospheric what it is in normal “air” which is ~20% O2. That would be 1V, which it does not achieve. I believe this means the cell is current limited.
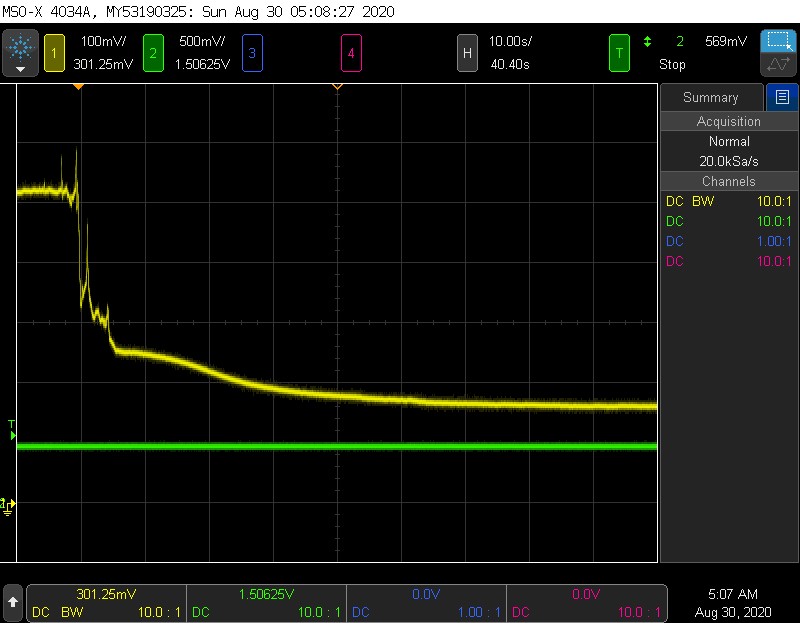
yellow = sensor
Here is the other end of that test- me tearing the bag to introduce normal air back in. From the initial jostle at 10s, it looks like it takes about ~1 min for the O2 to go back to normal levels. This is not representative of sensor performance because the gas actually has to get agitated for the O2 to go anywhere. In other words, it does not purely measure sensor response, but also incorporates the gas diffusing/getting blown away.
LINEARITY
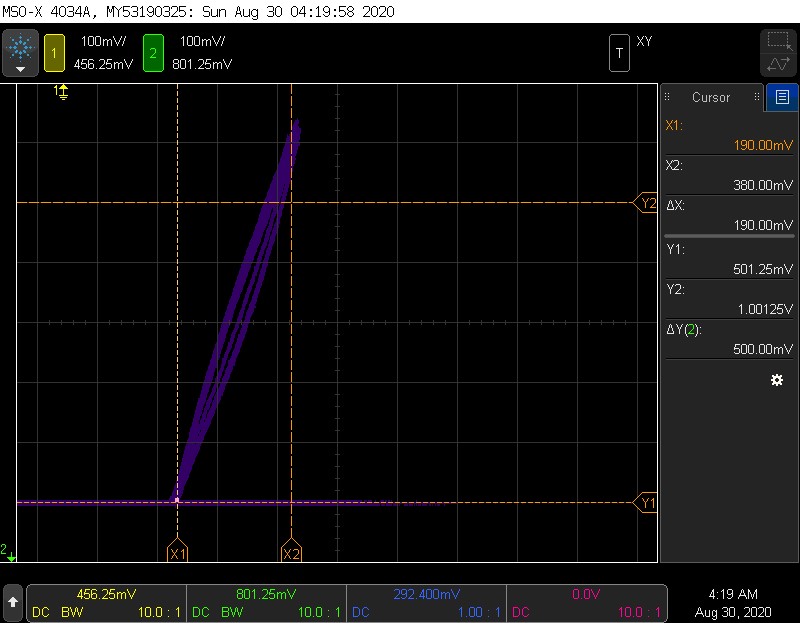
A good sensor is a linear sensor
This is a plot of pressure (Y) vs sensor value (X). To produce this, the chamber was cycled several times from 1 ATA (.5V) to 2 ATA (1V). Cursors represent the starting point, and where the sensor “should go” at 1 ATA. Doubling pressure should double sensor value from 190 mV t 380 mV, and that is almost exactly what the line shows. Doubling the pressure represents going from a PO2 of .2 to .4. The voltage is below the 500 mV that the sensor saturates at, so it comes out beautifully linear.
Since the sensor was cycled several times, we can detect some other interesting sensor characteristics, namely a small amount of hysteresis and non-linearity. The cursor generally tracks on the right side on the way “up” in PO2/pressure, an tracks on the left as PO2 drops. This means a sensor will read slightly differently after it has been exposed to higher pressure- it has “memory”. The maximum value of this is almost 50mV!
There is also straight up non-linearity, as the shape of the curve is not straight. However, this seems to be fairly small.
A single very slow run
Here is another hysteresis example, with the rise and fall done as slowly as possible. This should give an idea of the minimum hysteresis.
Slow and fast traces
Here is an example of a slow and a fast pressurization and depressurization. I couldn’t color the two differently, but it is easy to see that the rightmost trace (which was a pressure drop) looks quite different- it drops to 0 pressure then moves tot the left to drop the voltage. CURRENT LIMIT/RESISTOR SIZE

This is the setup I have, only the amplifier is an oscilliscope
I mentioned above that I used a 510 ohm resistor as a current shunt, and that the cell is current limiting. O2 cells, while read out in mV, are actually current-producing devices. Typically this is measured by putting a shunt resistor across the cell, and measuring the voltage. With low resistances, this produces a small voltage drop which can be difficult to measure. Higher resistances produce higher voltages- but you can only go so high! This is because the cell can only tolerate so much voltage across the cell*, and can only generate so much current. Therefore it is a balancing act to find an appropriate resistance to use- too small and readings get jumpy, too big and the cell wont change value at all, since it will be current limited.
*I am admittedly fuzzy on this but you probably do not want to get close to the open circuit voltage of the cell, which is 1.2v CONCLUSION
Why?
Building a galvanic O2 sensor is possible and actually fairly easy. I suspect even the polarigraphic sensor would have been fine if capped in electrolyte, and if it did not leak. The sensors can obviously be tuned to give good responses, as this is exactly the same way that commercial O2 sensors work. However, building a really good sensor that could be used for diving, where the sensor is monitoring life support, requires a lot of sensor characterization which is way beyond what I want to do. There’s a lot more to an O2 cell than just getting it to spit out a voltage proportional to the O2 concentration- for example:
- Temperature compensation
- shelf life/storage condition determination
- repeatable assembly/manufacturing processes
Any one of these could take a month (or longer) to do, and they would require a lot of units. I will stick to commercial O2 cells for now (and in the future), but now that I have a cell checker/pressure pot it should be interesting to compare a “real” cell to home made!
PIVOT TO A GALVANIC O2 SENSOR
After a maddening time with polarigraphic sensor, I decided I would try to build the galvanic flavor of oxygen sensor. After reading this tech tip from Oakton Instruments, it seemed pretty obvious that galvanic cells have big advantages. The main draw for me was that the output was easy to measure, eliminating the need for the fancy DMM. This would also simplify the electronics needed for reading polargraphic cell.
ELECTRONICS COMPARISON- GALVANIC VS POLAROGRAPHIC
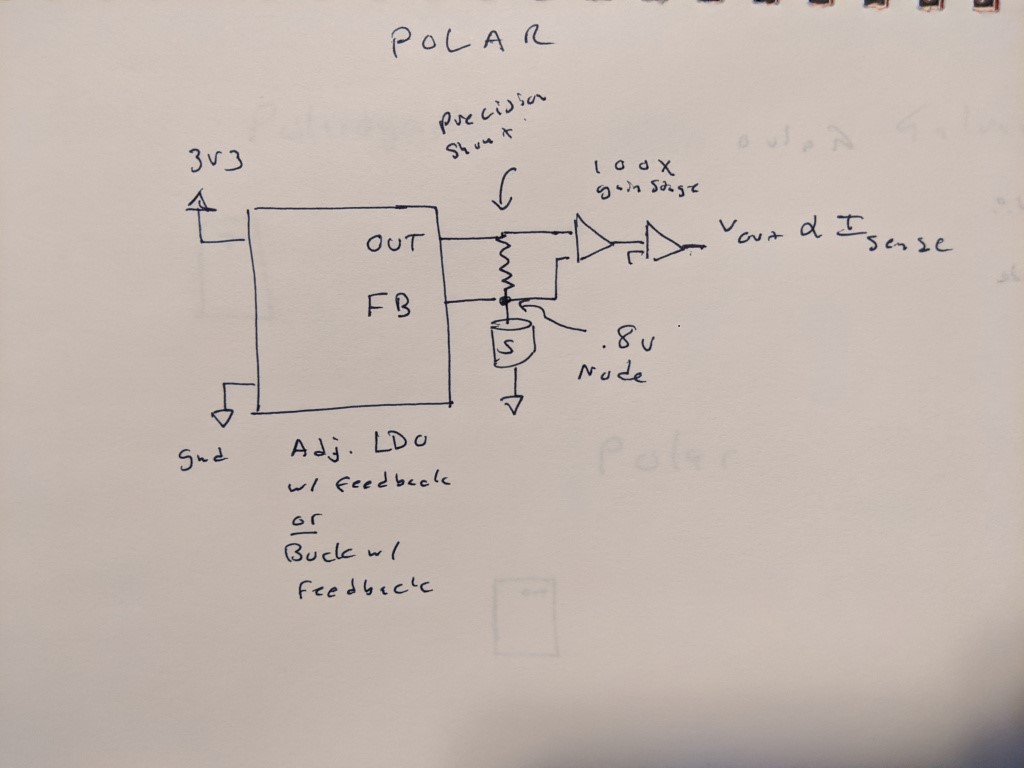
Here is what I think would be needed to read a polargraphic cell- a precision buck or LDO to bias the cell, with a feedback pin at the top of the cell. This eliminates the burden voltage of the shunt resistor that is fed into some kind of stack of op amps that then produce a voltage on the other side. This might not be so bad, and given that we have a 0 drop shunt resistor, we no longer need to worry about having a tiny burden voltage.
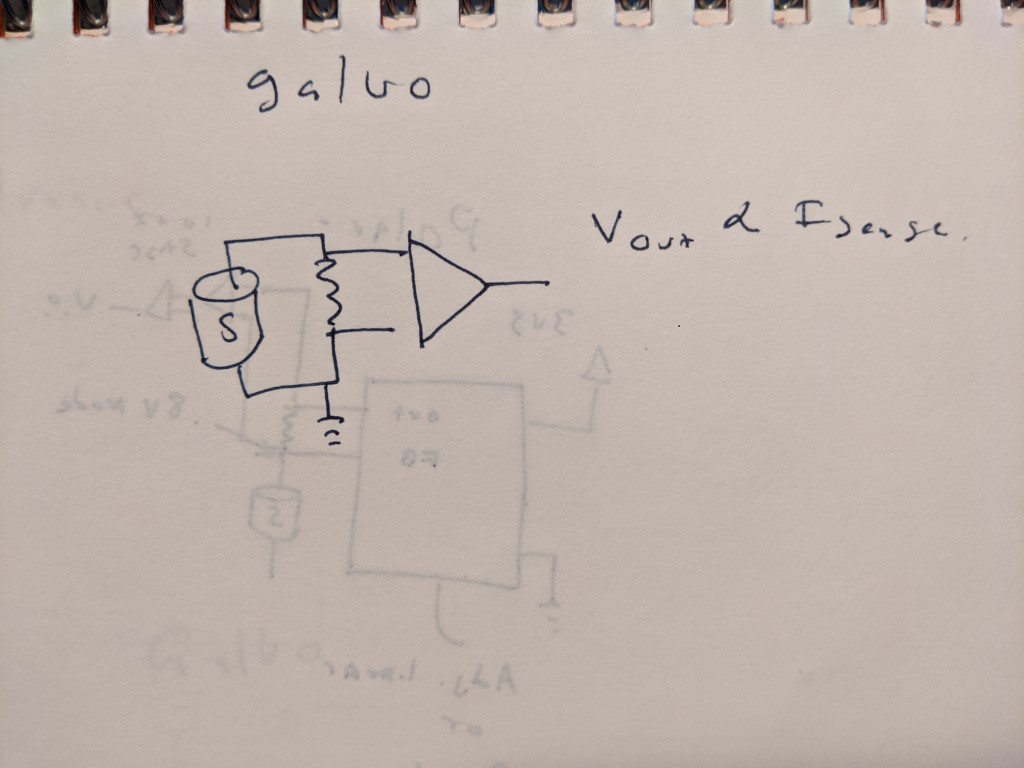
For a galvanic sensor, its pretty much as simple as it can be- a single resistor and a high impedance amplifier to match the voltage output range to the desired ADC.
CONSTRUCTION
The first galvanic sensor I made just replaced the silver electrode with a zinc electrode. Platinum or gold (or likely any noble metal) makes a good anode for this system. Zinc, in contrast to silver or platinum, is a very, very agreeable metal to machine. I can easily take a millimeter or more off at a 25mm diameter. The rod I got from rotometals appeared to be cast, although without any apparent porosity after ~2mm into the diameter. The one offputting thing is that zinc fumes are toxic, and the melting point is alarmingly low~ 400C. So all the operations were done with a lot of coolant, and the soldering to the electrodes was done very gently to prevent or minimize any zinc vapors.
As you can tell from me stating that there was a first sensor, there is also a second sensor. The first sensor seemed to have the same drift problem as the polarigraphic sensor, which makes me suspect that the root cause of both sensors drifting is electrolyte loss through the membrane or leaking at the press fit of the metal to the delrin. I also wanted to increase the area of the zinc so that the electrode and the volume of the electrolyte. More zinc will alleviate any concerns about using up the electrode, and more electrolyte will reduce the impact of loosing small amounts of fluid, or bubbles. This is because each bubble or amount of lost fluid will be small compared to the sensor, since it is bigger.
RESULTS
Step response to a blast of O2
Much like the polargraphic sensor, it kind of works. It certainly can detect a change in the level of oxygen, but it does it in kind of a non linear way. For example, I would expect that if 20% air is ~300mV, pure O2 should be 5x that, or 1500mV. It is possible that the cell just cant generate that much current, and that I should try a smaller resistor, but I certainly have not verified that yet.
With the improved sensor body, the sensor was also a lot more stable. It dropped a few mv over a fw hours, and its hard to know if that was related to temperature, drift, or the actual O2 concentration in the room. However, this stability was achieved over ~30 minutes as the sensor reached equilibrium. Likely the O2 in the bubbles in the electrolyte needed to be used up first, as they are in direct contact with the electrolyte. I suspect that after that happened, the sensor reached equilibrium with gas diffusing across the membrane and stopped sensing O2 trapped in the sensor.
A small dip from breathing on the sensor
On the other hand, it does seem very sensitive. Breathing on the sensor produces a small dip, and there is a noticeable difference in value (~30mV) from when I sit right in front of it and breathe on it vs when I leave the room- this is mostly anecdotal but interesting.
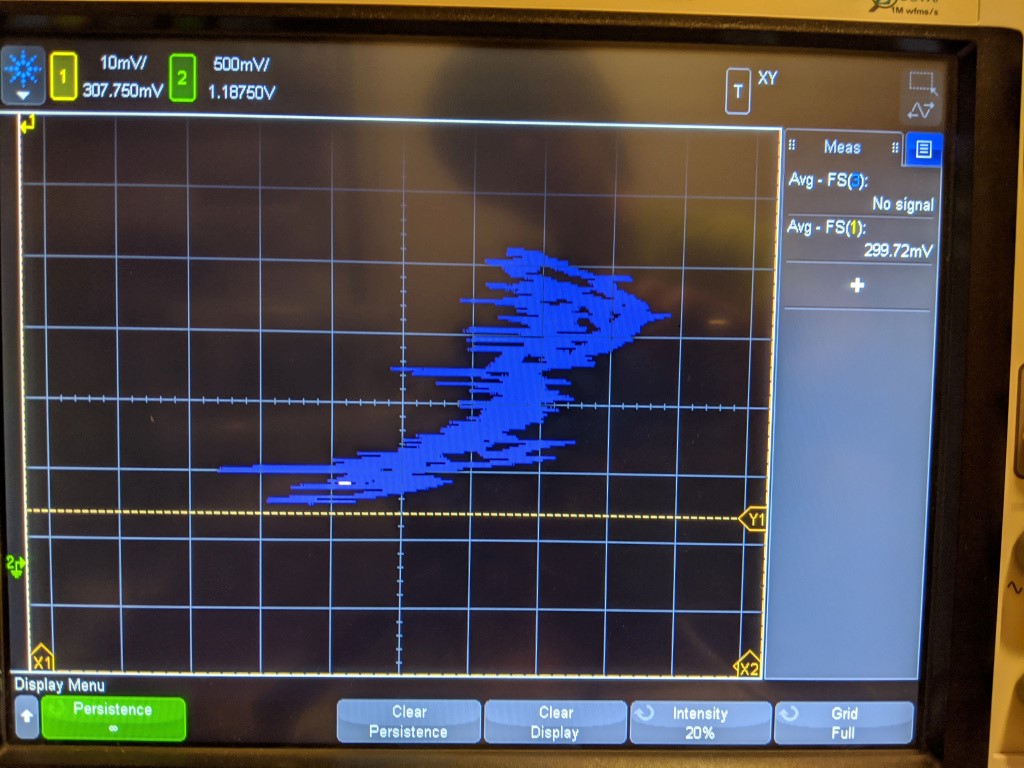
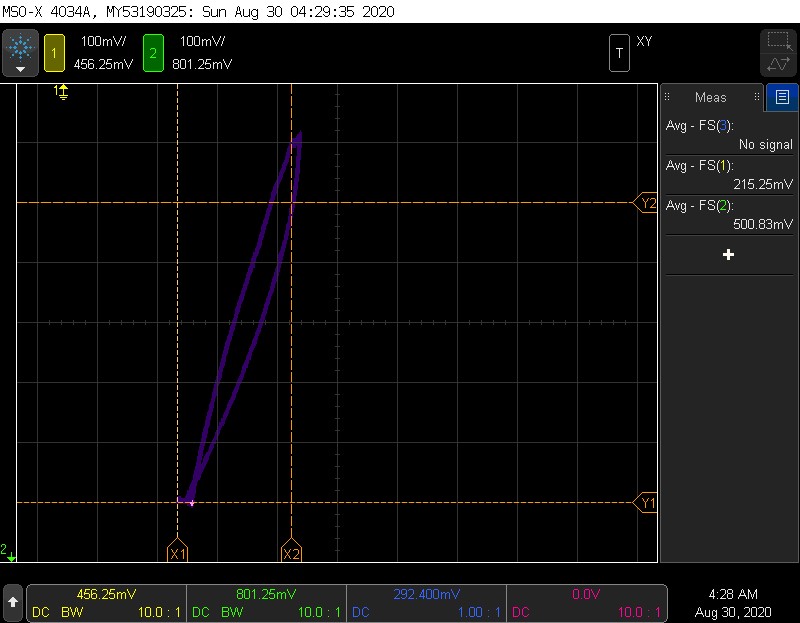
XY plot of pressure vs voltage of sensor. Thanks scope!
The linearity is not very good, as you can see. This is a plot of the pressure transducer vs the sensed voltage. Its all over the place, but is vaguely the right shape. Ideally the sensor should trace a straight line here, but there may be some hysteresis that causes non-linearity.
Unfortunately, just like with the step response, the change here should be much bigger. This test pressurized the sensor from 1 bar to roughly 6 bar- the reading should be about 6x as big, but it only went up a few mv! So this is not that impressive, as it shows either a non-linear sensor or some kind of enormous DC offset.
The last issue seems to be that the sensor leaks somehow. It may be that water vapor is permeating the membrane, because when left overnight the sensor dried out. In a humid environment like a rebreather this may not be a issue, but for storage it certainly is. This answers a question I have had for a while- why are rebreather sensors so slow? They are rated to a rise time of 6s to get to 90% of the final value. This is much slower than any of the sensors that I have seen, and does not seem to be an inherent characteristic of the sensor. My suspicion is that a much thicker membrane is used on rebreather sensors to reduce electrolyte water loss.
SEMI-CONCLUSION
This sensor seems a lot easier to use, but it seems like a lot of the issues I have noticed may be due to my membrane selection and leaking. I have parts on order for a larger pressure pot (the under $50 cell checker) to see if I can get the larger sensor to behave in a linear way with a polyethylene or FEP (or even teflon tape) membrane. I think this cell checker will be very useful for a number of other things like depth gauges/computers/ingress testing so I am excited to have it on hand. I will have to make an effort to keep my pressure pot electrolyte free this time!
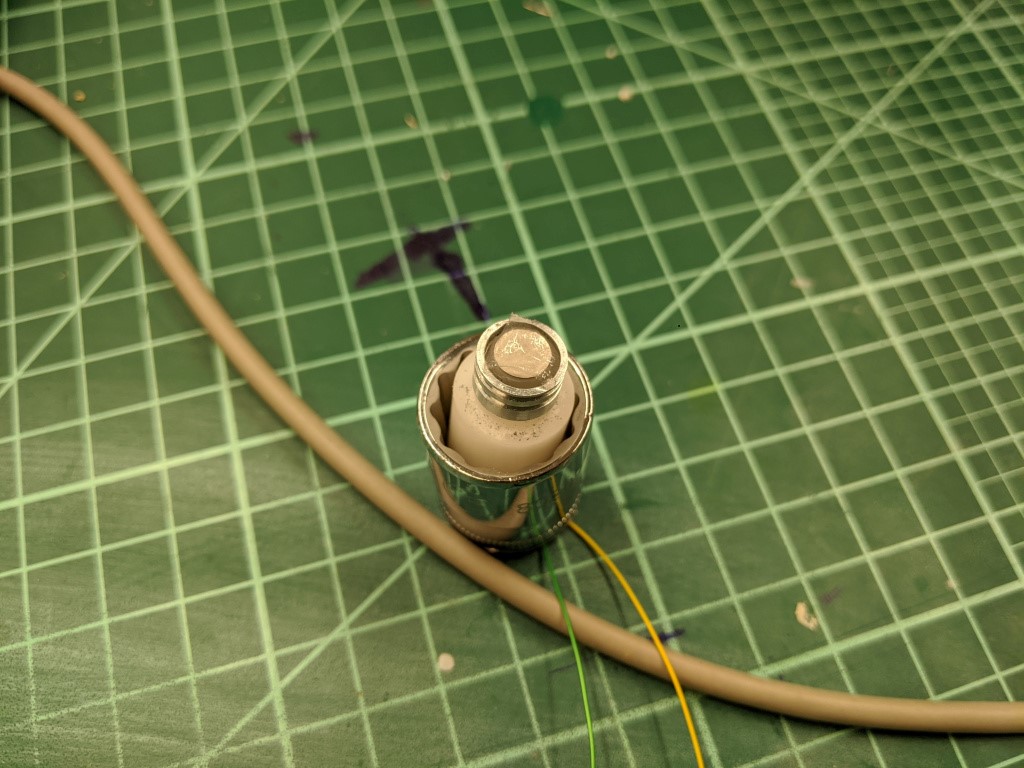
OXYGEN SENSOR AND THE SCIENCE JR.
Testing the oxygen sensor will need to be done over a wide range of temperatures and PPO2s, and the cheapest, easiest, safest way of doing this seems to be to not use pure O2 gas. Not only is O2 a somewhat “spicy” gas, but I don’t have a huge tank of it sitting around in my house.
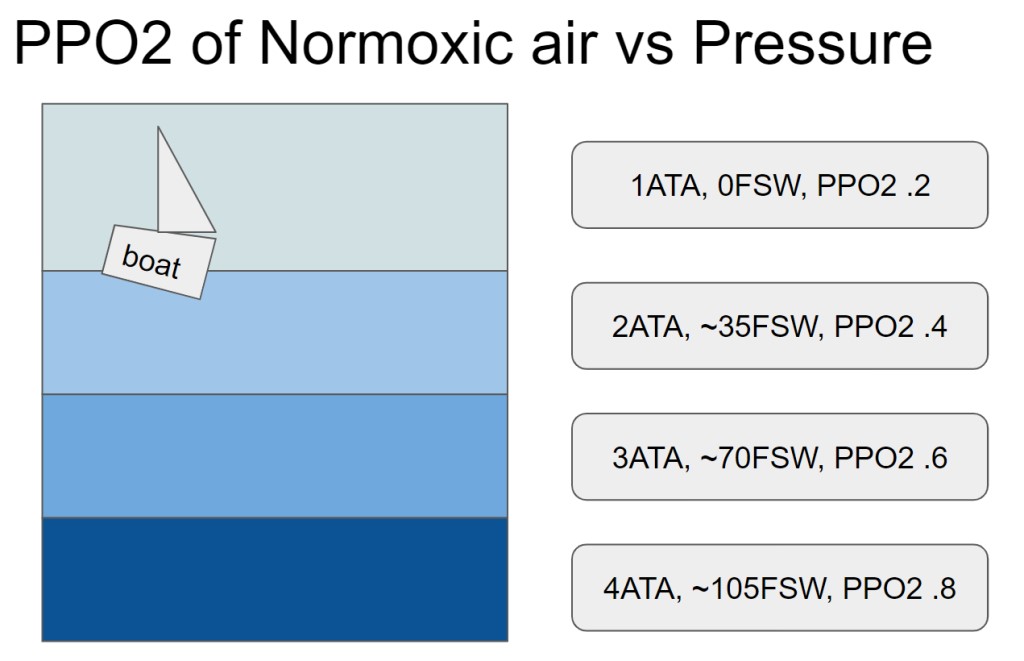
Instead, I intend to increase the PPO2 by increasing the pressure of the air- this will also prove out that the sensor works “at depth”. While that might seem magical, its pretty easy to imagine- as gas density increases at higher pressures, there are just more oxygens per volume bouncing around. The odds that one of these O2s bounces off the sensor go up as the pressure increases, and it is linear with depth.
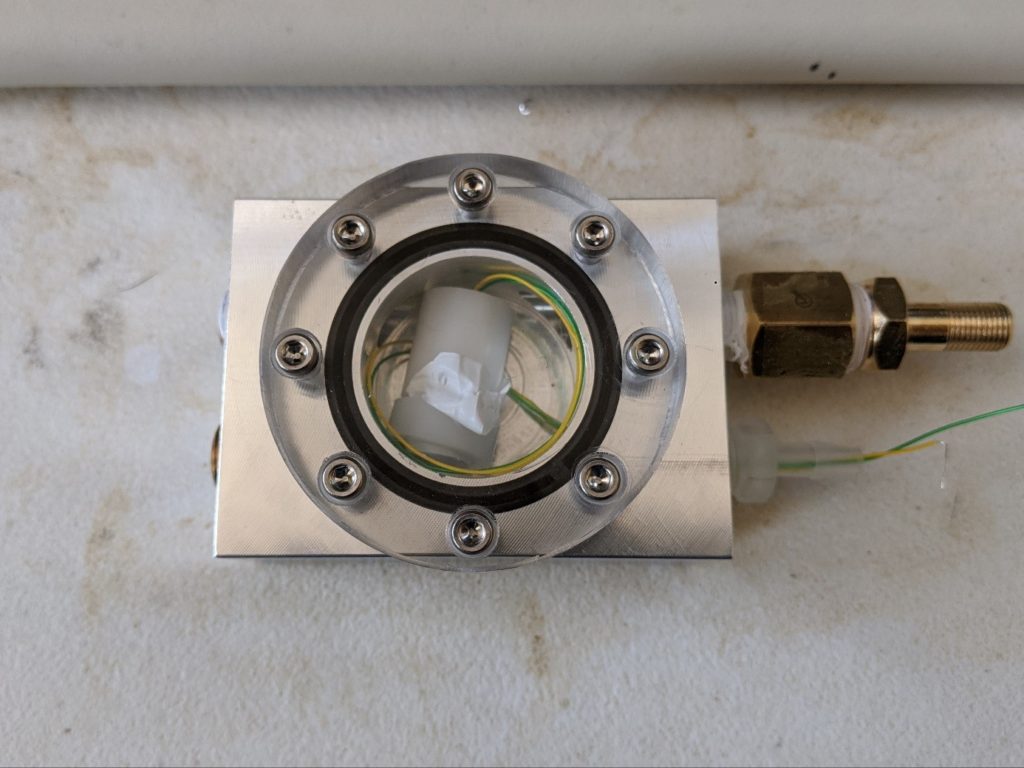
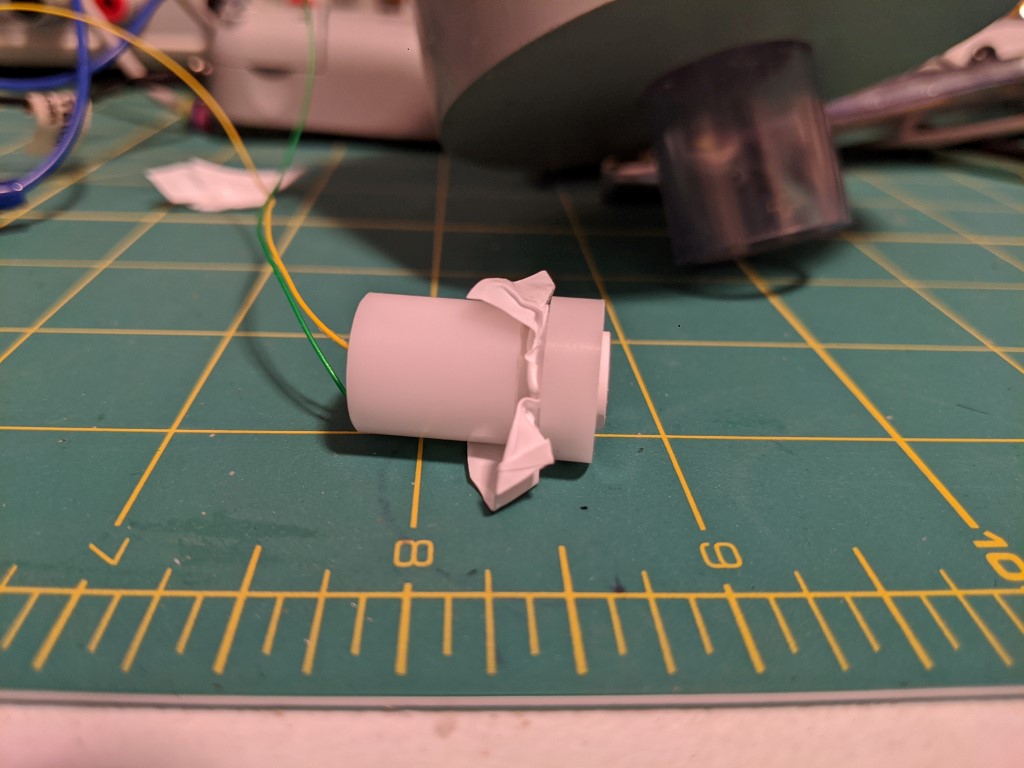
THE SCIENCE JUNIOR
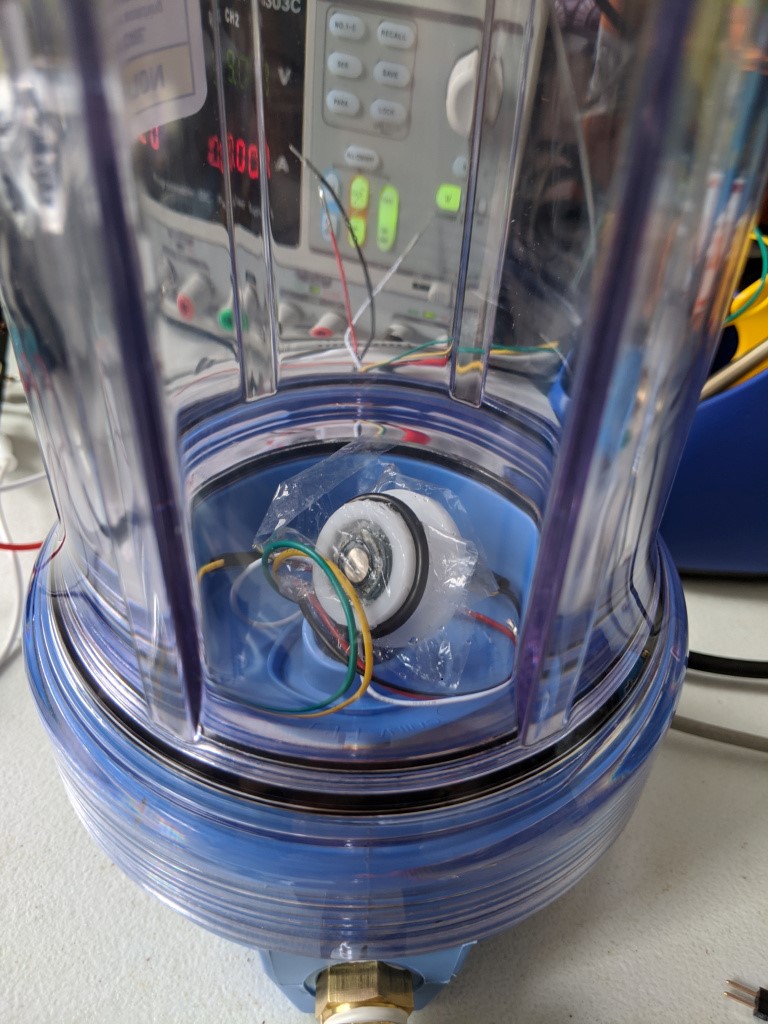
With this in mind, I set about what I am calling the Science Junior, since it looks like a generic science widget from KSP. Basically its just a small pressure chamber with a window and some NPT ports, which can be used for various purposes:
- Pressure port via schrader valve from bike pump
- Sensor wire pass thru
- Pressure sensor
- Gas infeed (?)
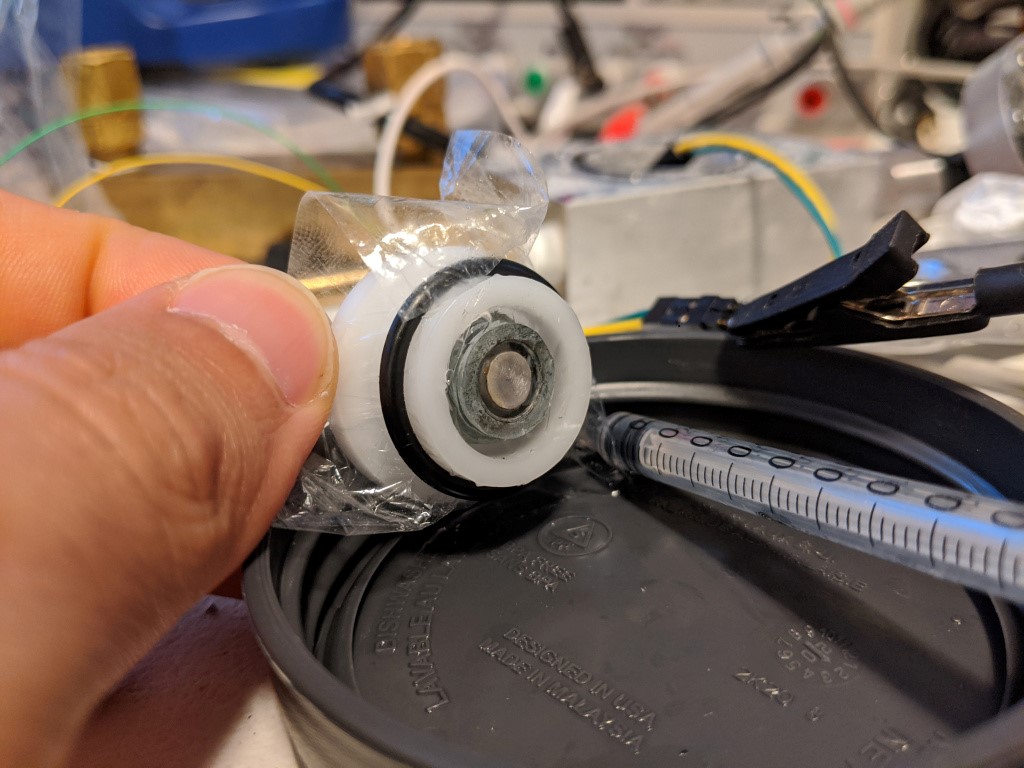
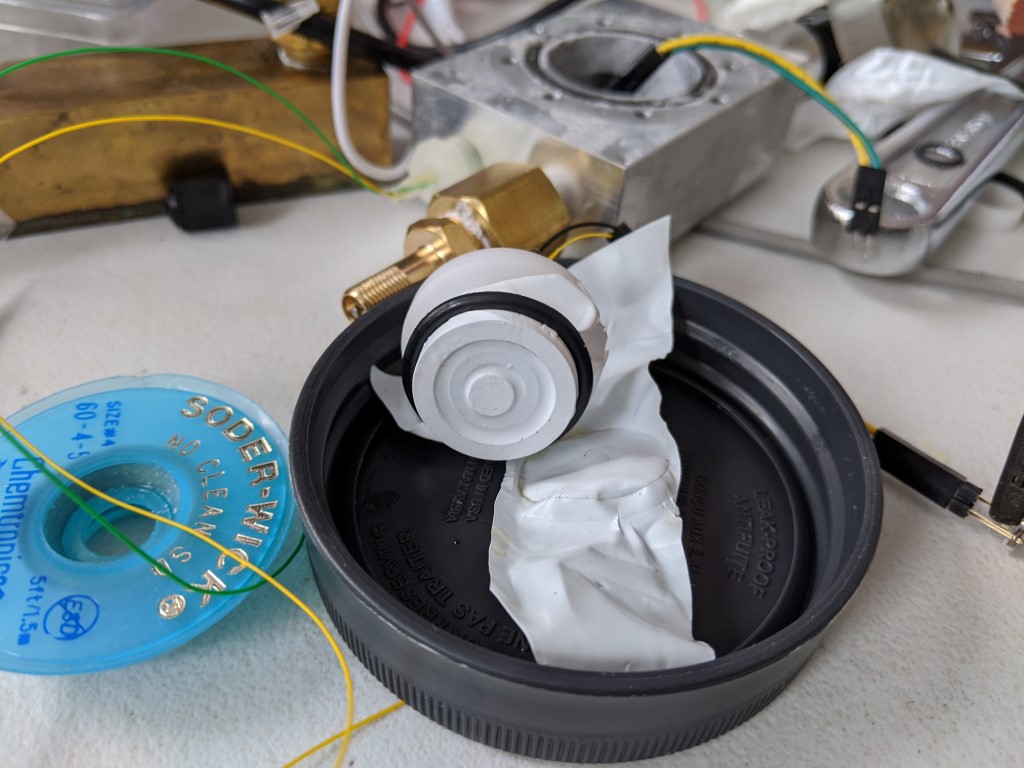
CONSTRUCTION
For those interested in the construction, the O ring is a just superglued out of cord stock and the sensor wires are run through a 1/8-27 NPT hose barb and epoxied in place.
Designed for a maximum pressure of 150 PSI, the 1/2″ thick polycarb cover and 8x M3 bolts should be more than enough to keep things together. There is about 1lbf per PSI so at 150 lbf I didn’t bother with the math.
One thing I would do differently is to use something removable for the sensor wire infeed, probably something that would get dropped in through the front and get captured by a lip on the inside, as shown in the sketch.
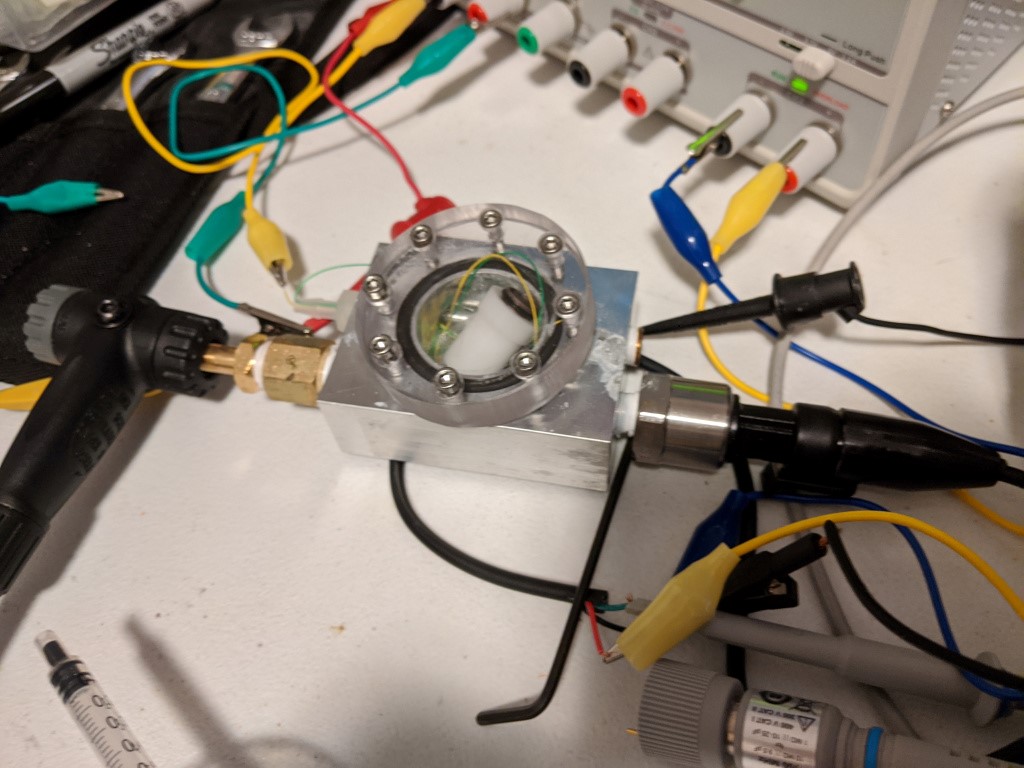
TESTING AND LEARNING
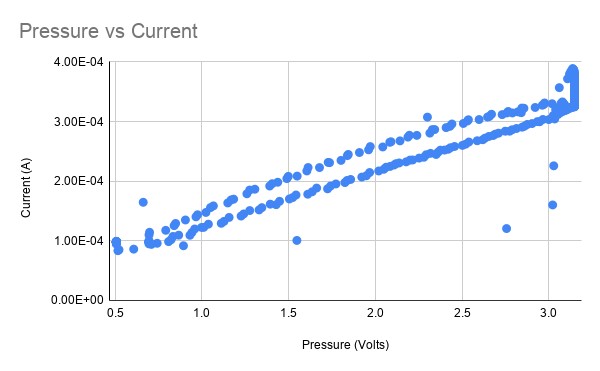
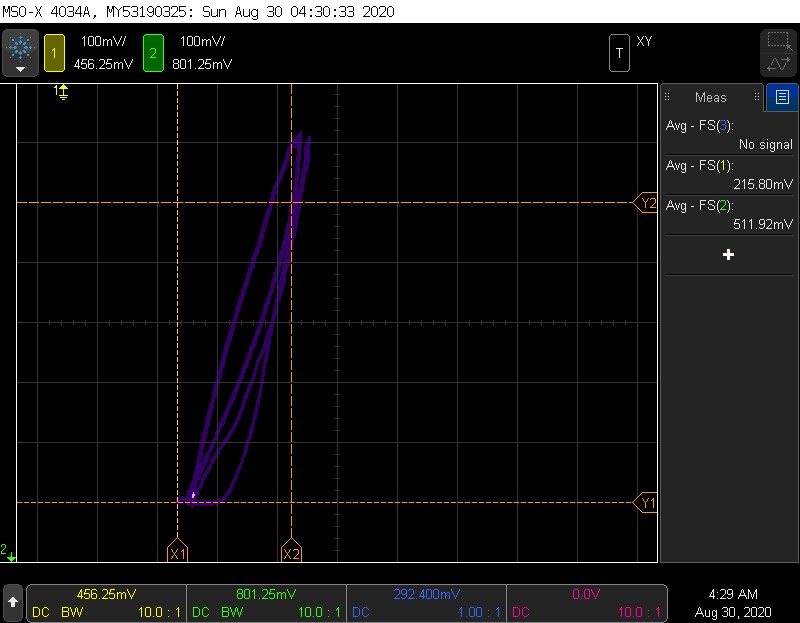
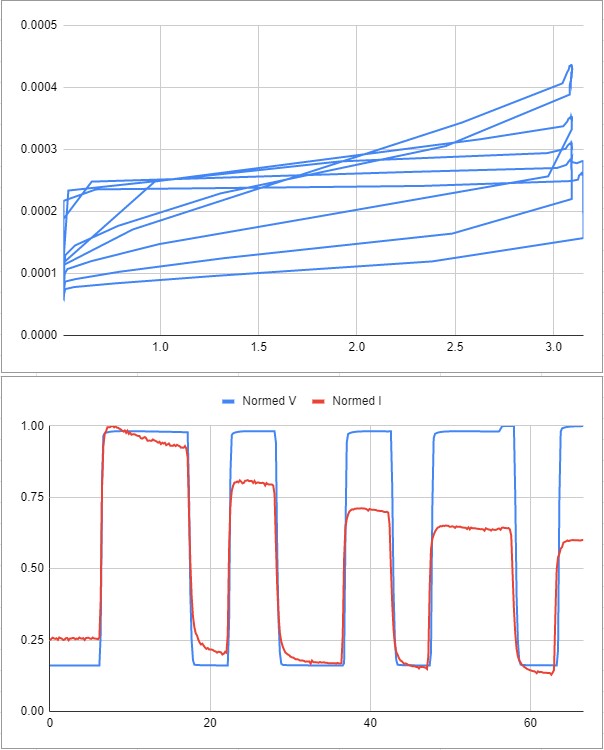
For testing, I set the bias voltage and logged the pressure (using a pressure to voltage transducer) and current of the sensor simultaneously while varying the pressure, which controls the PPO2. When the pressure is plotted against the current, it should be roughly linear. The chart above shows the sensor working reasonably well- however there is an odd drop of in current after being pressurized which manifests as a non-linearity in the chart above.
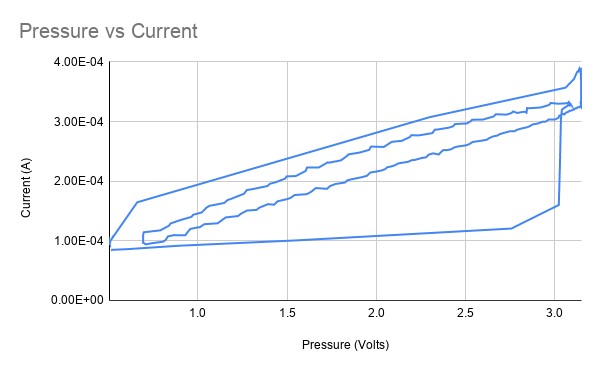
If we turn the scatter plot into a line plot to represent it as a time series, it looks a lot like a typical plot of hysteresis, but that seems like a red herring.
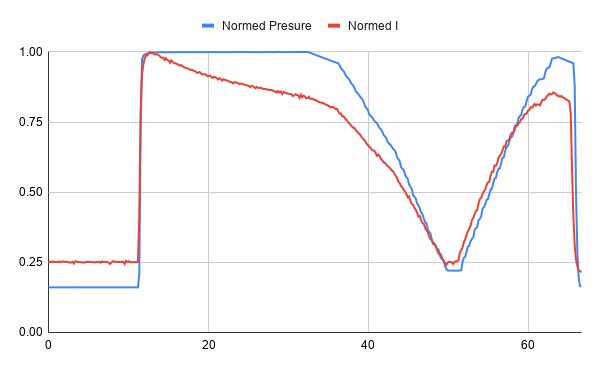
Normalized Pressure and Current for the same test
Looking at the normalized time series of the test, we can see that the sensor seems initially very linear, but then the current drops off after being exposed to pressure.
Here is some data from another test- the same strange trend occurs.
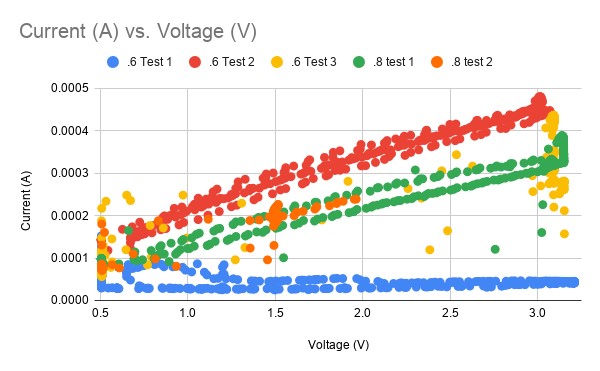
Looking at several sets of data we can see some that are complete garbage (blue data, yellow data, orange data) while some seem highly linear (green, red). Not exactly a good look for a mission-critical sensor that is helping you make life support decisions. Imagine trying to drive the speed limit if your speedo didn’t work!
TROUBLESHOOTING
I strongly suspect that pressure is playing a role here. First, sometimes gas is trapped under the sensor membrane, which causes the sensor to always read high, and to actually drop in current as pressure is applied. This seems to happen as the gas contracts and the membrane basically vaccum seals to the cathode. While oxygen is now coming into contact with the cathode, there is no opportunity for it to interact with the electrolyte, and this causes the current to drop.
Another factor is that in order to get the membrane closer to the cathode, I have had to burp out some electrolyte manually. This probably causes a slight negative pressure on the sensor as the membrane tries to regain its shape- I suspect that this can pull in gas and cause the gas blocking problem.
To solve this, I tried reducing the gap between the top lip of the sensor and the cathode, and making the sensors up “underwater” in electrolyte. This did seem to help with bubble elimination, but I still had a maddening and slow loss of current over time- uA over minutes or hours. these sensors show that good linearity can be achieved, but this drift is unacceptable for rebreather applications.
Additionally, I suspect that the sensor may not be fully watertight. That’s no good, since there needs to be electrolyte in there or it wont work! Some of the slow DC drift that I see could be due to this, or to evaporation through the teflon tape. The volume is <<1ml so even a small amount of evaporation could have an effect. I may try to remedy this or I may try to make a galvanic sensor…it turns out all I need is a little zinc or lead.
DIY POLAROGRAPHIC OXYGEN SENSOR: FABRICATION
I originally started by writing this post, but then decided to write a little more about the theory of polarigraphic O2 sensors first. This will skip most of the theory and just talk about how I built the thing.
MATERIALS
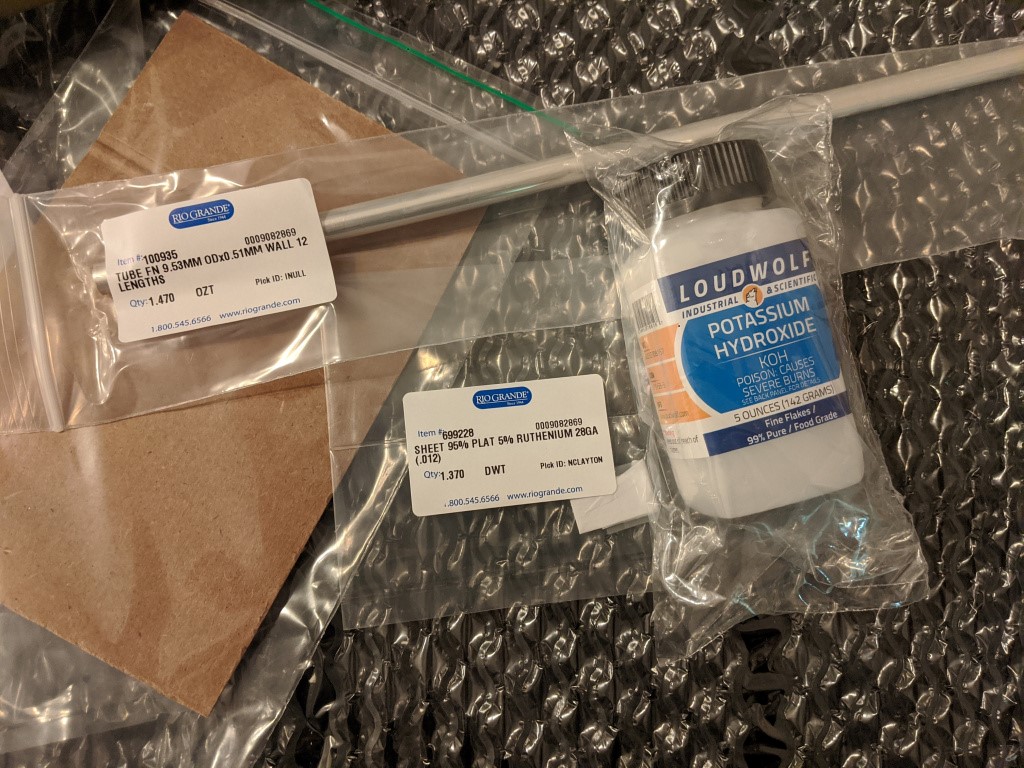
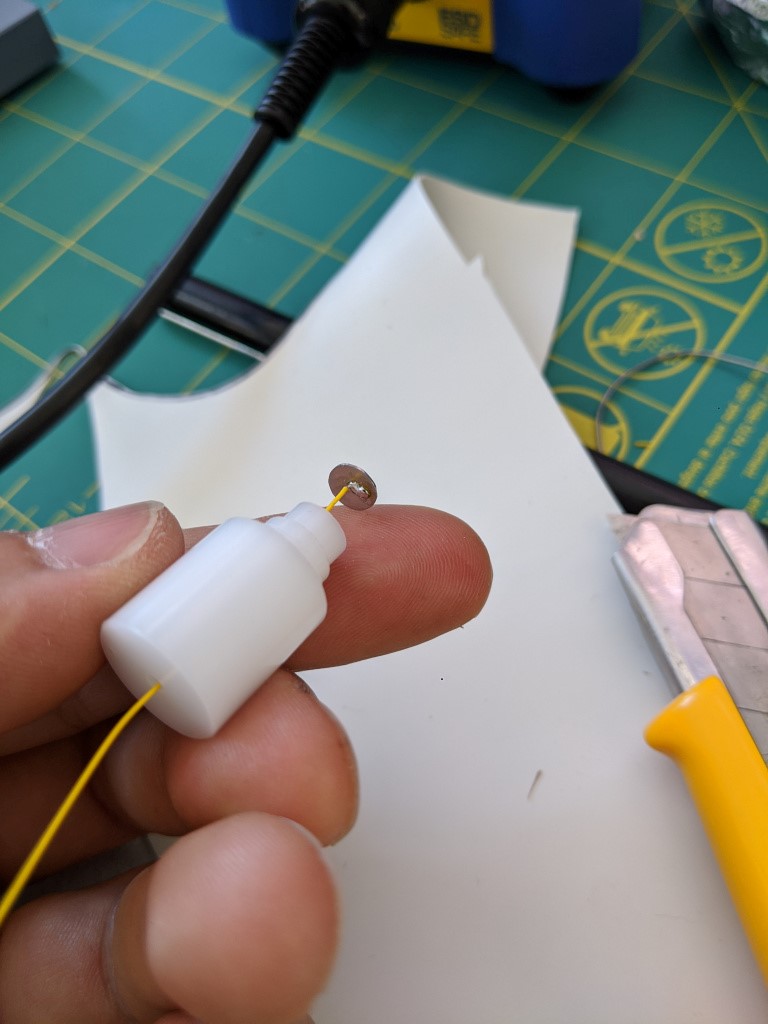
Aside from a few small wires and a small knob of delrin, this is what is needed for an oxygen sensor. A teeny chunk of platinum, a silver tube and Potassium Hydroxide (sold for making soap).
KOH ELECTROLYTE
Based on some unscientific googling, I made up a ~4M solution of KOH because it seems to be a relatively common concentration. The electrolung used a .5 N (normal) solution and other papers quote 1 N solutions. For KOH, normality is the same a molarity, so I will need a much less concentrated solution in the future.
The three big takeaways here are that:
1) KOH seems to be kinda nasty stuff, and it should stay far away from your skin.
2) KOH is hygroscopic (picks up water), so it should probably be baked at 100C to remove water before weighing. I didn’t do this so who knows what molarity my solution really is- its “4M or below”
3) Mixing KOH into water is exothermic and also takes a while to fully dissolve. If you don’t know what you are doing, it seems best to let the angry little salts do their own thing.
KCL ELECTROLYTE
After writing this and doing some testing, I found that KCl was also a fine electrolyte. 1-3M solutions can be purchased for a reasonable sum on amazon as dissolved oxygen (DO) cell storage solution. It would also be quite easy to make a solution of KCl, but I didn’t want to deal with dehydrating the salts.
KCl is my preferred electrolyte since it is more like salty water than draino. It feels a lot safer to be pipetting salty water at my desk vs super draino, and were I to re-do this I would skip the KOH for this sensor.
FABRICATION NOTES
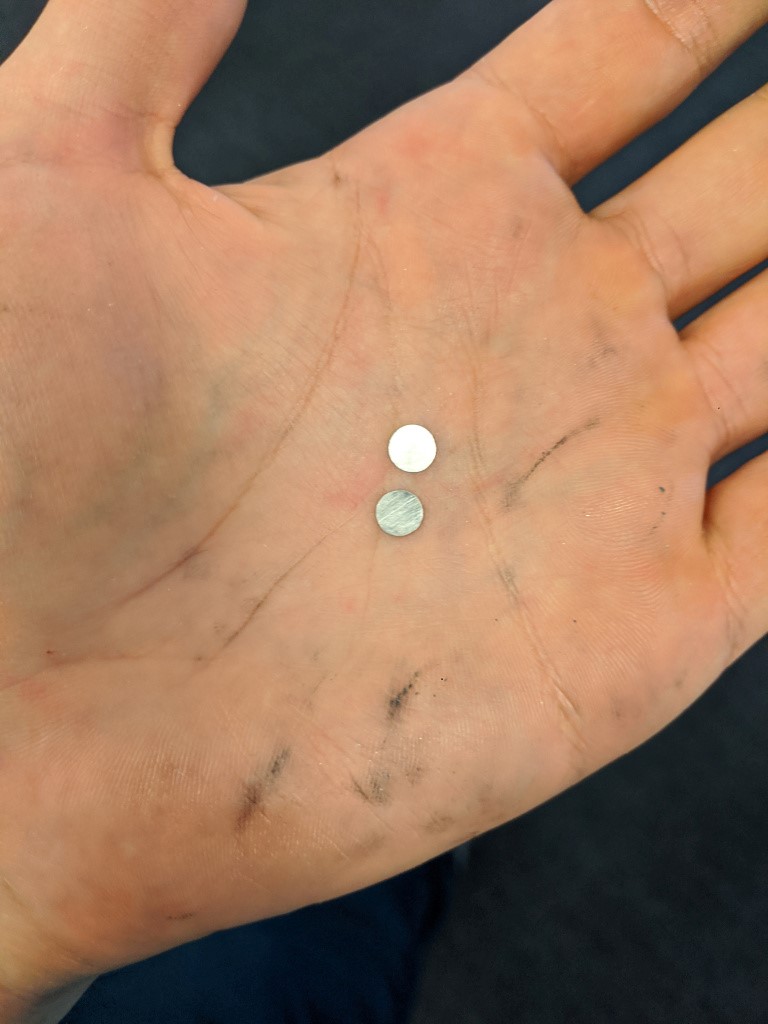
The 6mm diameter platinum electrodes were cut from a small sheet of 95% Pt 5% Rh from Rio Grande. Pt is surprisingly dense, and actually very annoying to machine for many reasons- it is tough, and compared to other materials, expensive. So to get as many parts as possible, I went with a “boring” operation using a .5mm 4fl carbide endmill with ~.00025″ chip thickness and .0015″ feed per revolution. I think that sawing electrodes out with a jewelers saw is probably a little easier, since my fixturing method (2 side blue tape + superglue) did not hold up to machining for one of the electrodes. Fortunately, I recovered that electrode with some filing (which worked very well). The short version of this is that there is absolutely no reason to CNC machine this stuff.
The silver anodes (999 Ag tube) were machined on a lathe. Aside from the fancy oring gooves, there’s no reason this could not be done with a hacksaw (gently, so as to not mess up the tube). Originally I wanted to use a rubber boot instead of orings, but that would have taken longer with what I had on hand. The electrodes are 6mm long with an OD of .375″ and an ID of .335″.
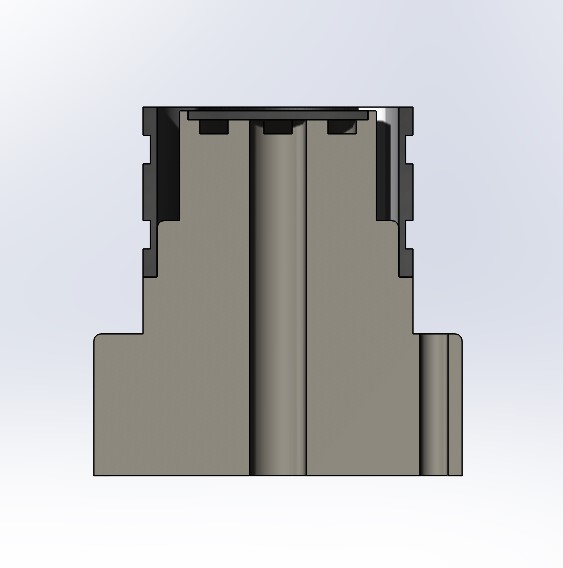
Cross section view of sensor
The body of the sensor was made of delrin. As you can see in the cross section above, there are some grooves here and there for things like wiring the Pt electrode as well as a pocket for the electrode. There is even a hole for wiring the silver electrode, which is not necessary (but it is nice).
Since the o-rings were a last minute addition to avoid finding and drilling a hole in rubber, I also made a delrin sleeve to fit over the orings and hold on the membrane.
ASSEMBLY
First a wire was soldered onto the Pt disc. This was done with normal SnPb electronics solder. This wire was run through the sensor body, and a dab of silicone was used to seal it to the body housing. NB these electrodes are pricey and a pain to make, but are also extremely reusable. Using silicone makes them more recoverable. For a “real” sensor, there is also room in the wiring hole to fit a thermocouple for temperature compensation.
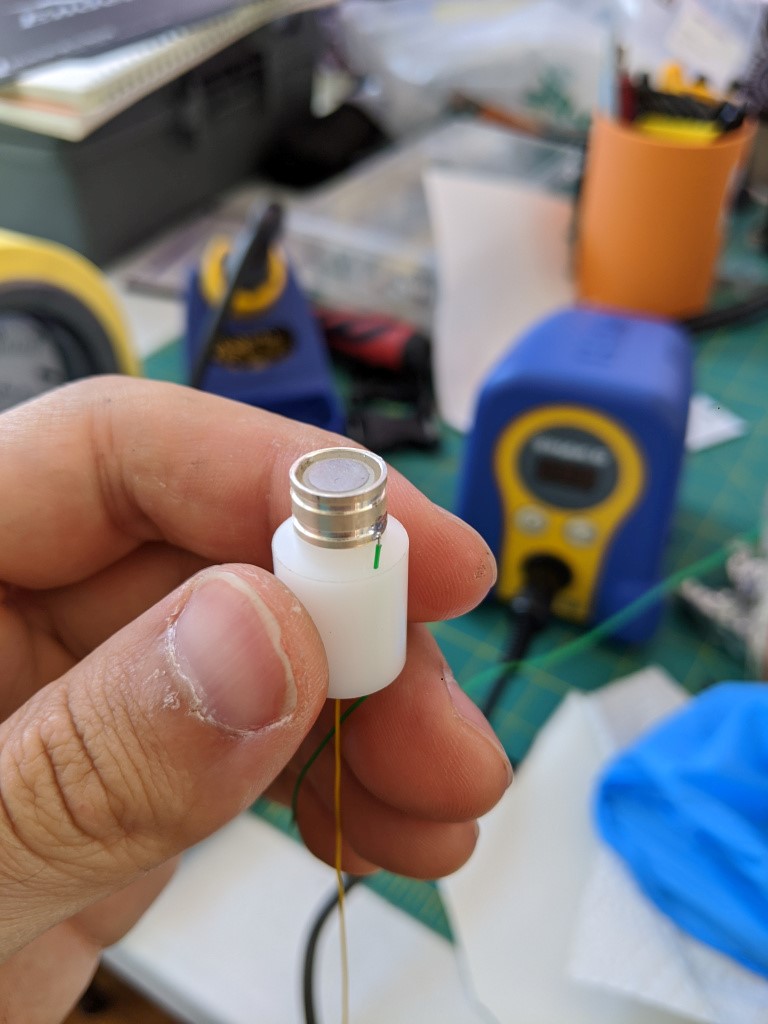
Next, the silver electrode was added, and a wire was soldered on. This extra hole gives me some pretty slick wire routing. NB this was done by sanding down the silver a little to get the solder to wet. I don’t think silver oxides are easy to solder to so this needs to happen before the sensor is used.
With the orings assembled, a few drops of electrolyte are added to the surface and a teflon membrane was stretched overtop, before placing on a retaining ring to hold the teflon in place (pinched between the orings and the ring). The “teflon membrane” is plumbers pipe tape. TESTING
With the sensor wired up, of course I was curious if I had just completed an expensive art project or if I had actually made an oxygen sensor. Fortunately I had enough spare rebreather parts around to shoot some O2 at the sensor.
Initially I was disappointed because the sensor seemed to not do anything aside from operate like a galvanic cell that reacted to oxygen (see previous post). However, after switching to a very sensitive DMM (keysight 34465a) I was able to read uA changes based on O2 concentration with .6-.8 V of bias voltage. Typical current of the cell in air was very low- maybe less than 10uA. Blasting it with oxygen bumped it up to ~100uA. The response time was extremely low (immediate, as far as I was concerned).
I intend to do a little more work on this sensor, including improving the membrane, making up a proper electrolyte solution, and (of course) testing and temperature compensation. This kind of sensor is cool- unlike gold-lead galvanic cells, it seems like they can be revived with a little electrode cleaning and adding fresh electrolyte (kind of like sea monkeys). In the electrolung, they were actually hard-wired into the rebreather*.
According to the electrolung designers, they are also less sensitive to water covering the membrane. Another nice feature is that in theory, because they constantly consume all the O2 in the electrolyte, a polarographic sensor should fail low if it looses contact with the gas to be measured. This is more obvious than a galvanic cell that may have an O2 concentration “locked in” by water, which could make the PPO2 appear good when it is not good. A cell failing low will be an obvious indication that it has gone off the rails because if the cell reads 0 and you are still breathing, there must be oxygen somewhere.
This does not mean that is necessarily a good idea. The electrolung was not a huge success, in part because sometimes people drowned while using it. Additionally, to my knowledge, nobody has decided to use polarigraphic sensors in breathing equipment since then, although they are used for some really cool stuff like measuring cellular respiration rates and dissolved blood gasses.
DIY POLAROGRAPHIC OXYGEN SENSOR: THEORY
If I had a dollar for every time someone tells me I’m going to die using my oxygen rebreather, I would have about $6. However, I did royally freak out two local divers who were mystified by how I could use a rebreather and not know my ppo2. While I kind of know my PPO2, I thought it would not be a bad idea to actually measure it. And with O2 sensors in a global shortage, and with a smidgeon of knowledge from rebreather history, I figured I would try to build my own. This has turned into a much bigger project than I expected initially, and the project is certainly not done, but I have learned a ton about oxygen sensors.
HISTORY: THE FIRST PO2 SENSORS
1969 is when Walter Stark and John Kanwishwer introduced the ‘Electrolung‘, which was among the first electronically controlled rebreathers. It seems like it was the first time that one could really know their PO2. John Kanwisher had recently improved the Clarke Electrode (1962, used to prove that extracorporeal oxygenation works), creating a non-fouling oxygen sensor by using a teflon and polyethylene as an oxygen permeable membrane to protect the electrode.
Construction of the Electrode
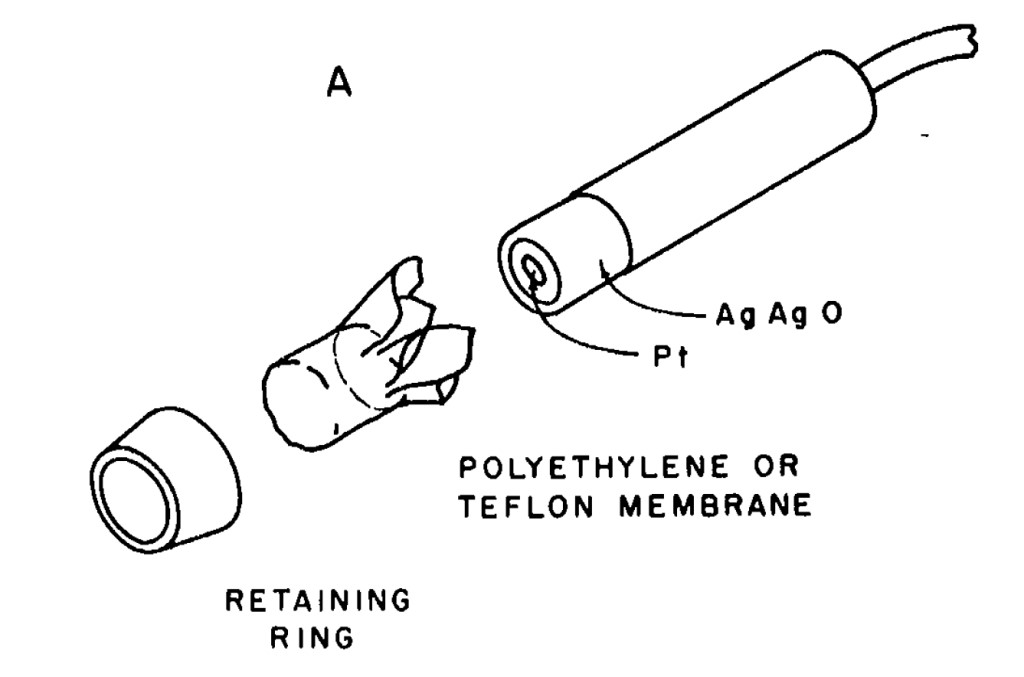
Figure from “Polarigraphic Oxygen Electrode” by John Kanwisher
Mechanically, as you can see, the electrode is pretty simple. A Platinum disk with a silver-silver oxide electrode is covered by teflon, after trapping some KOH electrolyte underneath it. Less simple is the reaction. As I understand it, at the platinum electrode, dissolved O2, water, and electrons from the bias voltage to form hydroxides. At the silver anode, silver and hydroxides form silver oxides and electrons. One difference between the original clarke electrode and modern electrodes is that modern cell use KCl. Both certainly work, although KCl makes AgCl instead of Ag2O. I believe the reason for this switch is that KOH solutions are very chemically active and will turn people into soap, while KCl is a lot less active. Oddly both are food additives, although KCl has an LD50 of about 10x that of KOH.
The original paper suggests sticking the whole sensor into a vat of KOH solution and capping the sensor under the solution, so it seems a lot less scary to do that with salt water instead of a strong base. I hope they wore gloves (but I suspect they didn’t)!
Most importantly- it is key to understand what dissolved O2 is supposed to do in this sensor- it allows current to flow with a bias voltage across the cell (variable impedance), unlike a galvanic cell which causes current to flow (fuel cell/battery). OBSERVED SENSOR BEHAVIOR
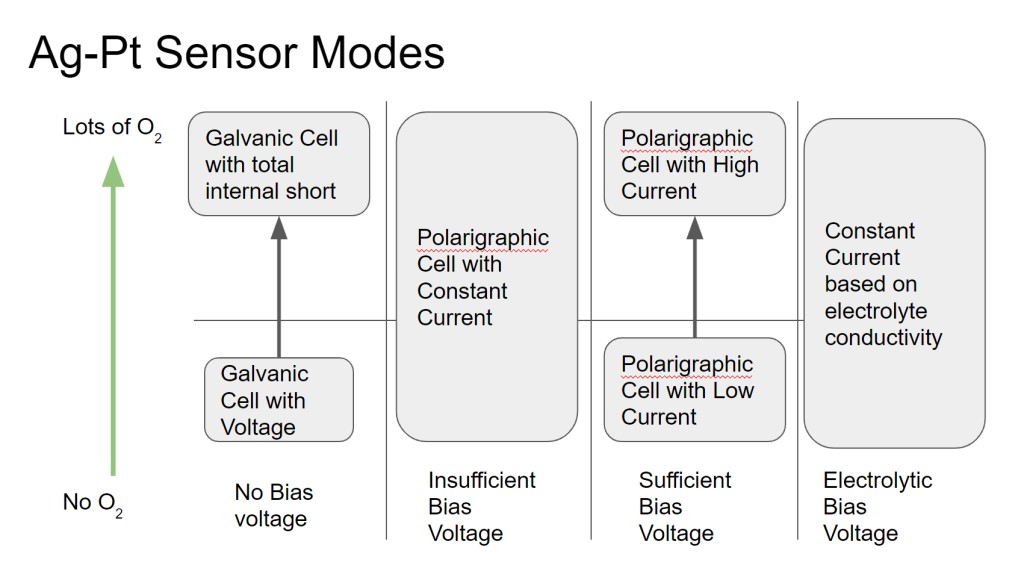
This type of oxygen sensor seems simple, but there are some subtleties that make the behavior a little difficult to understand. Below I will try explain some interesting observed behaviors of the sensor, and why these things happen. The chart above is a handy key to the rest of this post, which will discuss what happens as the bias voltage on the sensor is increased from 0V.
NO BIAS VOLTAGE (GALVANIC MODE PT-AGAGO CELL)
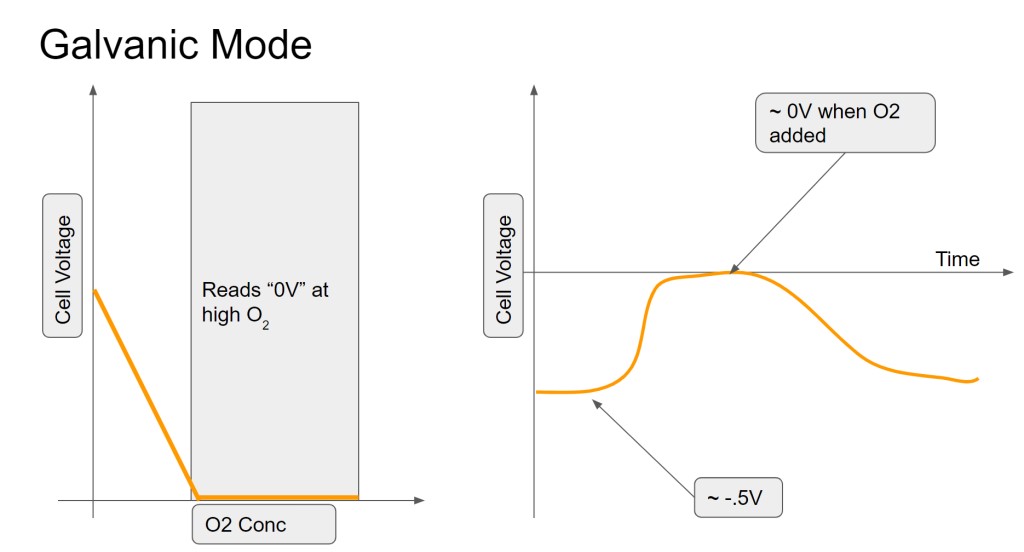
In this mode, the sensor is producing a voltage instead of a current. As most people know from things like potato clocks and glavanic corrosion, two dissimilar metals in an electrolyte will tend to produce a voltage (across the metals). Based on my measurements and not my knowledge of chemistry, it seems like it is still the case with this cell- a small voltage (500mV) is produced between the Pt and Ag in the electrolyte. However, when exposed to oxygen, it seems like that voltage is reduced, probably by discharging the accumulated charge (voltage) back through the electrolyte. This can be considered an internal short across the electrodes of the electrical cell. However, measuring oxygen based on the blocking of this charge accumulation (voltage) does not make for a good sensor and since the voltage source is very weak, has a long recovery time (minutes/seconds). It also reads 0V (saturates) below an amount of oxygen that is useful to measure. In other words, the readings get clipped below the O2 fractions that would be useful.
INSUFFICIENT BIAS VOLTAGE (CONSTANT CURRENT)
In this mode, there is enough oxygen that the cell produces a constant current, since the “use” of the O2 is much slower than how fast the O2 is replenished. This mode should be avoided for sensing since an increase in O2 will not be noticed, since the O2 in the cell is always not depleted.
SUFFICIENT BIAS VOLTAGE (CURRENT PROPORTIONAL TO O2)
In this mode, the voltage is high enough that O2 is immediately used when it enters the sensor. Therefore, the current that is produced is related to how much O2 is moving across the sensor membrane. This is the “sensor” mode of a polarigraphic O2 sensor. Again, if the size of the electrode is too small or if the membrane is too large, at high O2 concentrations the O2 diffusion could possibly catch up to the current and saturate it.
One interesting thing is here is that when the bias voltage is switched on, there will be a large spike in the current for a short time (<1s) before it settles into its “sensing” current. This is the current produced when the dissolved oxygen in the sensor is initially depleted, and it can be large- on the order of 1000s of uA (~1 mA)! If operated in the insufficient bias mode, this spike will not be seen.
HYDROLYSIS BIAS VOLTAGE (CONSTANT CURRENT)
At this voltage, the water in the electrolyte will start to break apart and form gas. I would imagine that the current here is dominated by the conductivity of the electrolyte, but I haven’t made any measurements here.
WHAT THE HECK IS A POLAROGRAPH?
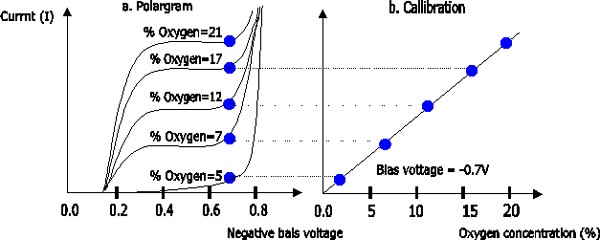
from http://www.usbmeter.com/Theory_DO.htm, an excelent reference
That’s a good question- the polargram is a representation of the sensor output, so called because it measures the response vs the electrode vs. the polarization voltage. The chart above shows what we should be able to measure with the sensor.
WHAT O2 SENSORS REALLY MEASURE
In the sufficient bias range, more oxygen speeds the reaction and therefore increases the current. Current is proportional to the dissolved oxygen in the electrolyte, which should be limited by the diffusion across the membrane and the size and proximity of the Pt electrode to the membrane.
Polarigraphic and galvanic lead-gold sensors are sensitive not to oxygen mass or oxygen fraction (% makeup of gas that is O2), but essentially measure the rate of diffusion across the membrane (assuming they are working right). This is then calibrated to some known O2 concentrations, usually two of whatever is conveniently available- 0% (nitrogen purge), ~21% (air) and 100% (O2 purge).
This diffusion should be related to the prevalence of O2 in the sensed gas or liquid. Normal air, at a higher pressure, will have a higher availability of O2, and O2 will diffuse faster. Oxygenated media flowing by the sensor will have a higher availability than non-moving media. Temperature will also affect gas solubility and diffusion.
OXYGEN GAS SENSORS FOR DIVING
For diving, the pressure plays a large role in O2 sensing. As breathing gas is compressed, the pressure increases quite a bit (up to about 4x pressure at recreational limits). When divers talk about oxygen sensors, they really are talking about measuring the oxygen partial pressure. Given some container and gas mixture, a partial pressure is the pressure a gas would have if it were allowed to take up the whole container without the rest of the gas mix. Surprisingly (or not) the sum of the partial pressures equals the pressure of the whole mix.
For nitrox-savvy folks, reading PPO2 at the surface works out easily to O2 fraction (% of gas by volume) since the oxygen measurement is happening at the surface at 1 ATA. For nitrox, this PPO2 is then used to figure out how deep you can go (increasing PPO2) before you hit a maximum PPO2 limit.
For rebreathers applications, the thing that is interesting is direct reading of PPO2, so there is no need to convert to O2 fraction. As pressure increases, so does partial pressure of oxygen, creating a higher pressure differential of oxygen across the sensor membrane, resulting in faster diffusion, which is then sensed.
Avery, a VERY impressive story, not many people build and test their own Oxygen cells, CHAPEAU.
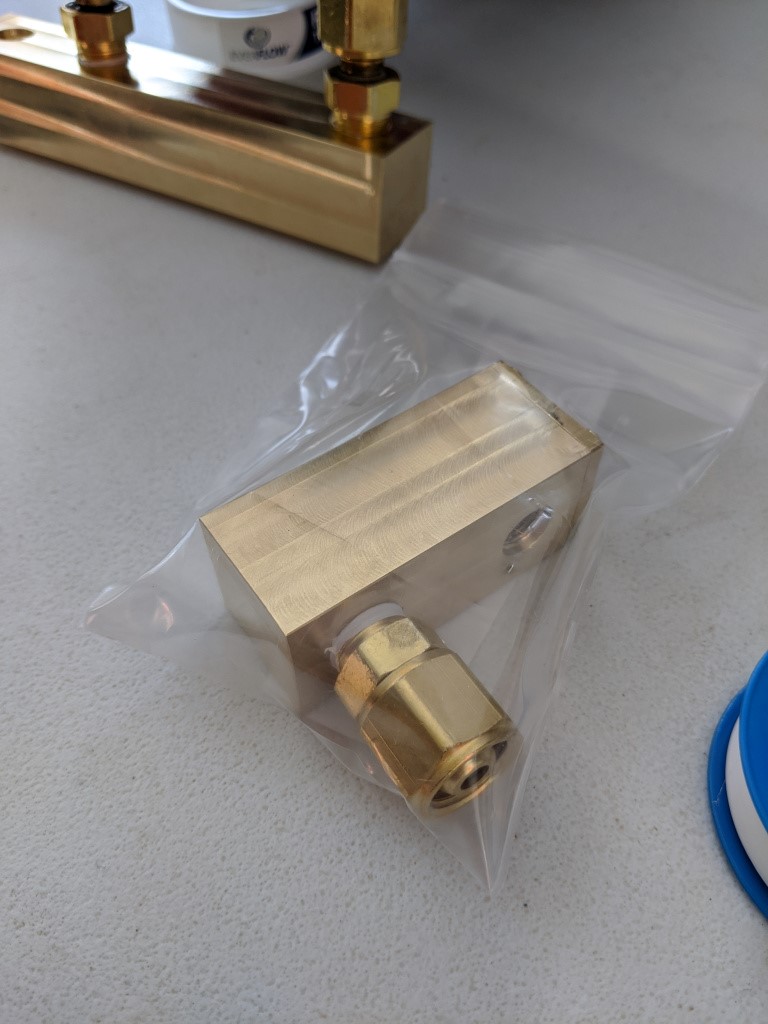
As a bonus Avery publishes here his manifoild from the nudibranch rebreather
MANIFOLDED O2 FOR REBREATHER
MAV-1X and MAV-2X
The more gas you have on a dive, the more time you have underwater, and the larger a safety margin you have- although for an oxygen rebreather in a non-overhead environment, it mostly adds to dive time. I wanted to be able to carry not one, but TWO disposable oxygen bottles on a dive, so I went ahead and built a “manifold” based on the MAV components from my previous rebreather.
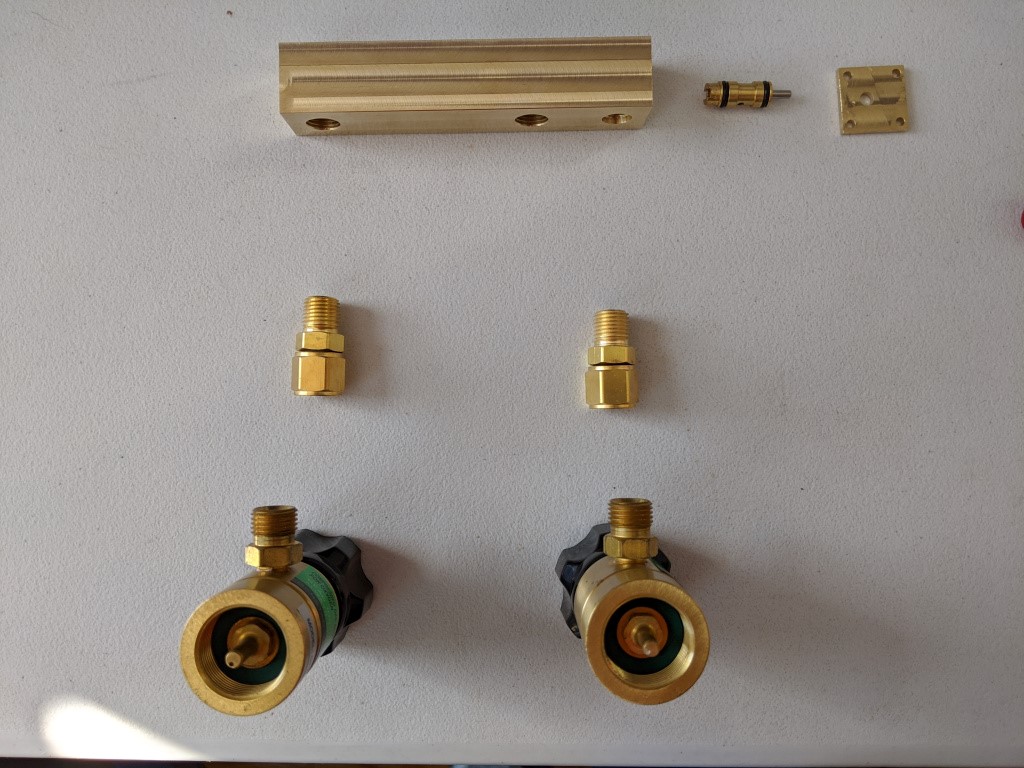
Here is the MAV 2x in the exploded state. With all brass components, galvanic corrosion, should be kept to a minimum. I may also try nickel plating them after polishing, for even more corrosion resistance. Polishing reduces surface area, which also helps combat corrosion.
At the bottom are a couple of off the shelf mini-oxygen bottle regulators. These have a male (thread) B-sized oxygen fitting on them, for an oxygen hose. Since I want to stick these into a manifold and not have the bottles interfere, I needed a rigid connection that lets the two sets of threads be independent. These fittings are right in the middle- one end is NPT and one end is a female B size fitting (P/N WES-123 for the curious). The NPT end is affixed to the manifold, and then the nuts are tightened onto the regulators. Since the threads are on the nuts, and not on the stem attached to the NPT, the bottles can be in any orientation.
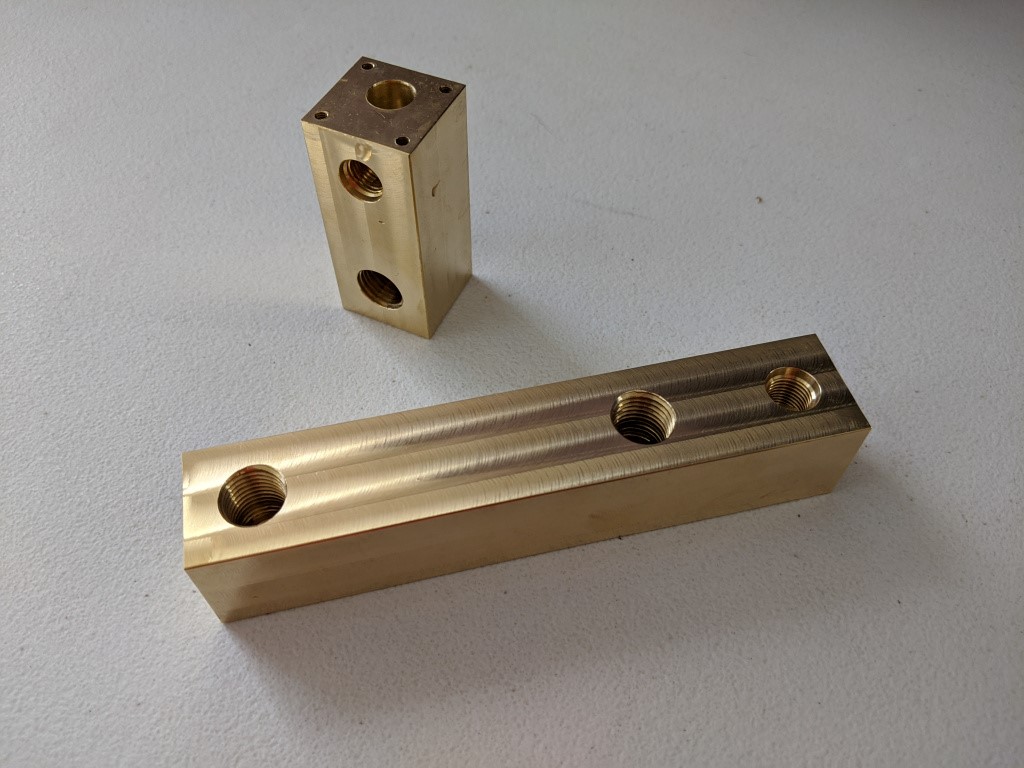
Original 1X MAV
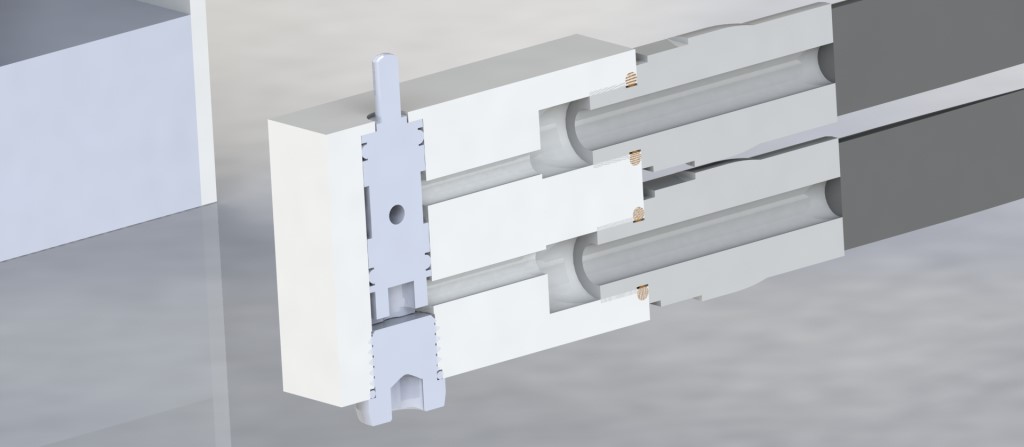
This is very similar to the original MAV, but it has been simplified by putting the MAV directly on the cylinders, which will be front mounted on the diver. This simplifies the gas routing, and eliminates a connection. Another improvement is that the bore for the cartridge valve is not a through hole- this means that the back does not need to be sealed up, eliminating an extra seal.
The cost for the reduced leak path count is that chip evacuation is more difficult in the long hole (roughly 4.25″ x .25″ drill- 17xD hole) and there is an additional, difficult to machine cover that retains the cartridge valve. If this is not installed, the cartridge valve will shoot out of the MAV under pressure. It is definitely an area to watch out for when the valve is pressurized. However, with such a long bore, there is not a good way to be able to machine the valve bore from the reverse side. Fortunately, the cross sectional area of the valve is quite small, so even at 500 PSI, which is the tank pressure, the cover only needs to resist ~50 lbs, across four M3 screws.
MAV-1X
Of course, not every dive requires two oxygen bottles, and with no gas installed the inside of the regulator would be filled with water. So that the future rebreather can be operated with just one cylinder, a 1X MAV was produced. Cant wait to try it out!
LEAK TESTING NOTES+ CONCLUSION (?)
This wont make much sense unless you have read the previous posts about leak testing my rebreather counterlung. These are more lab notes than anything. Also, there are no good pictures until the end.
TEMPERATURE-PRESSURE DEPENDENCE
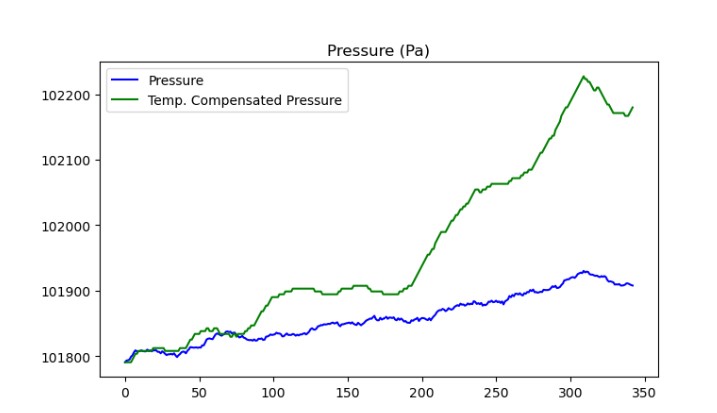
The first thing to do when you get some data is to ask if it makes any sense. Much of the time, some small mistake has been made, like inverting an axis. In this case, there is some strange behavior. The pressure (blue line) is going up. That is pretty weird since the volume is not changing, and gas is not being added to the device under test.
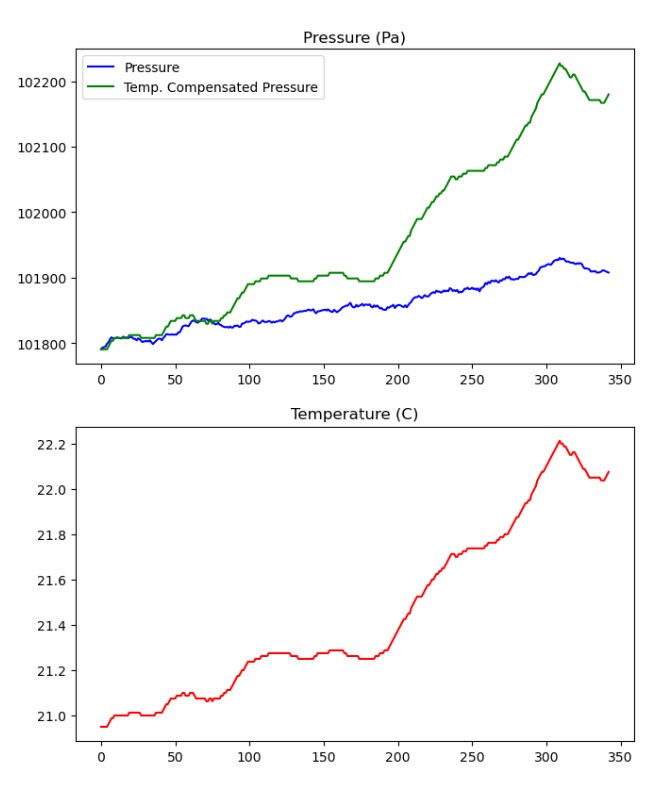
But now, looking at the temperature, it starts to make sense. if the whole room gets hot, and the air in the bag cant expand, the pressure will go up! I created the green line, which represents the expected pressure based on the initial temperature and pressure, assuming no change in volume. But as you can see, that line looks about right, but is quite a bit higher than the blue line.
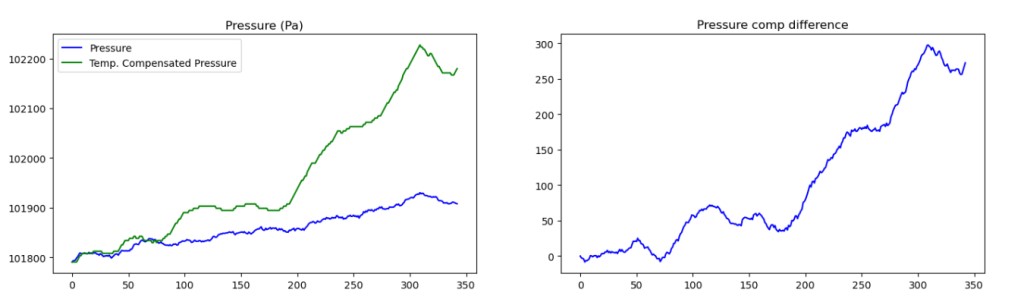
Might need to expand this one to view properly
Lets plot the difference- this is the temperature-compensated pressure drop after the whole test has run. The X axis here is roughly in minutes, so over six hours, it 300 Pa is the calculated difference between what was measured at the end of the test (accounting for pressure) and what we should have had! That is about 1.2″ H2O- a fairly small leak- about 30 ml of air at NTP, or .04 grams of gas.
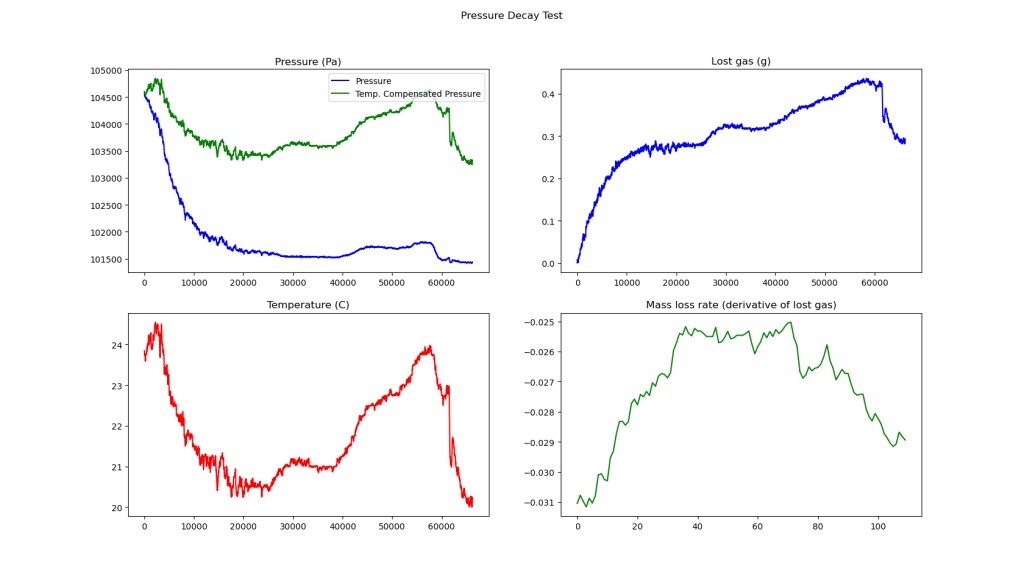
These are the final iteration of plots I am using to look at leak behavior. The first one is the temperature compensated pressure shown with the internal pressure. From here you can eyeball the pressure difference. This is displayed above the temperature chart, so its easy to see that temperature correlates to pressure. In the top right chart, the gas loss is shown, which is convenient since that is applicable to design. Finally, the bottom right chart shows gas loss rate. It is not as useful as I expected.
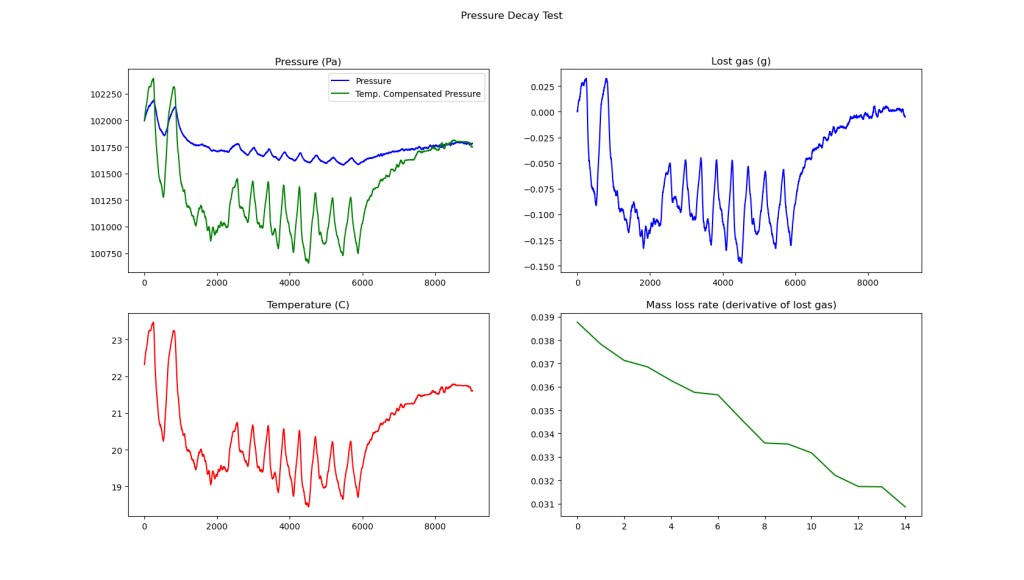
This was a long test done with the air conditioner on in a sunny room. Here there is some additional bad behavior. This test was done with the counterlung lying in a pool of water, with a thermocouple taped to the outside (on top). Interestingly, from the top two charts we see that we start and end with roughly the same gas volume- no leakage, which makes sense because this test was done at only 2.7 inches of water (~675 Pa), a very low pressure differential. However in the middle of the chart, the Temperature compensated pressure is up to ~900Pa lower than the measured pressure, which ends up going back to 0 at the end of the test.
This shows something that has not been compensated for- thermal lag of the air compared to the sensor, and any temperature difference between the air in the the bag and the the sensor. The sensor is very small, and is not well connected to the air in the bag, while the air in the bag is lying in a pool of fairly thermally stable water. However, the data still seems good if the temperature is allowed to settle, as it does towards the end of the test.
LEAK FLOW BEHAVIOR
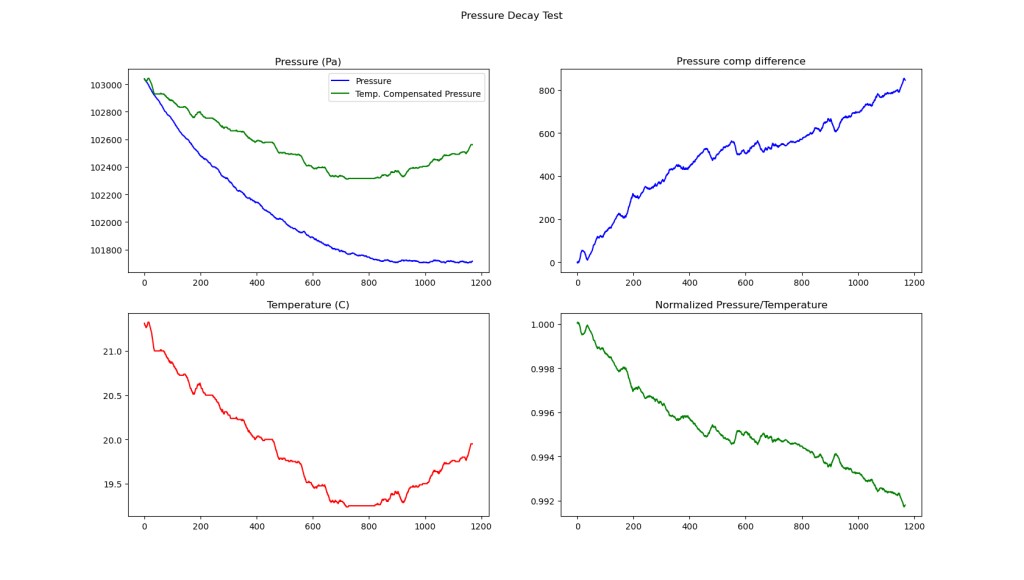
In comparison to a lot of high pressure leak tests, the flow from the bag is certainly not “choked”, like it would be in something like a constant mass flow orifice. We know this theoretically, because the upstream pressure:downstream pressure ratio is only 1.03, and because it is easy to see that the leak rate changes significantly with pressure in the chart above.
ATMOSPHERIC PRESSURE
Unfortunately, barometric (atmospheric) pressure is very important for long term tests. Barometric pressure, usually reported in inches of mercury, changes throughout the day. 1″ Hg is 13.6″ of water, which is quite significant for these tests!
If the atmospheric pressure goes down 1″ Hg, the differential pressure should go up, while if the pressure increases, the pressure differential goes down. Since I am only measuring a pressure differential, ending and starting at different barometric pressures will throw the test off. However, short term test results or tests that are conducted on stable weather days seem like they should be ok. Obviously adding a barometer to this (an absolute pressure gauge) would make it much better but I don’t think I need that information to decide if my bag is airtight enough over the short term.
I do have a barometer, in my watch (and probably one in my phone, now that I think of it), but it is not simple to import that data into my testing process. However, the data I do have shows that the pressure is usually pretty stable- within 2-3 mbar, on “nice” days.
CONCLUSION
A good picture- one that is not of a graph
I think after all this testing that the leak rate seems low enough. Although there is technically a little bit more I could to to verify the leak rate, it seems like a roughly a few inches of water/hour, at ~15″ of water, which is the maximum operating pressure. Since the leak rate should go down with a smaller pressure difference, I expect to be well within the EN limits for a single valve. Before I do a bunch more testing, I will want to get all the rest of the fittings onto the counterlung.
SOME NOTES ON DATA:
A nominal atmospheric pressure and a 13 L volume were assumed for mass loss calculations.
Just to clarify why everything looks so smooth: data was smoothed with windowed averaging with a window size of 10, different data rates appear throughout the data, with the original tests I did being at a rate of 30s/sample and later tests being at ~1s/sample to provide better averaging.
MORE LEAK TESTING + DATA CAPTURE
Gas, for the most part, should stay inside of a closed circuit rebreather- that’s sort of the entire point. So leak testing is very important- important enough to automate to get really good data. Unlike reading a gauge with your eyes, automated data capture, if done right, can make it easier to capture a lot of data, and it takes out errors caused by a person interpreting an analog gauge face. I also wanted to add temperature measurement, as that seemed likely to cause pressure deviation, even to the point that the pressure in the volume under test seemed to go up.
TEST SETUP
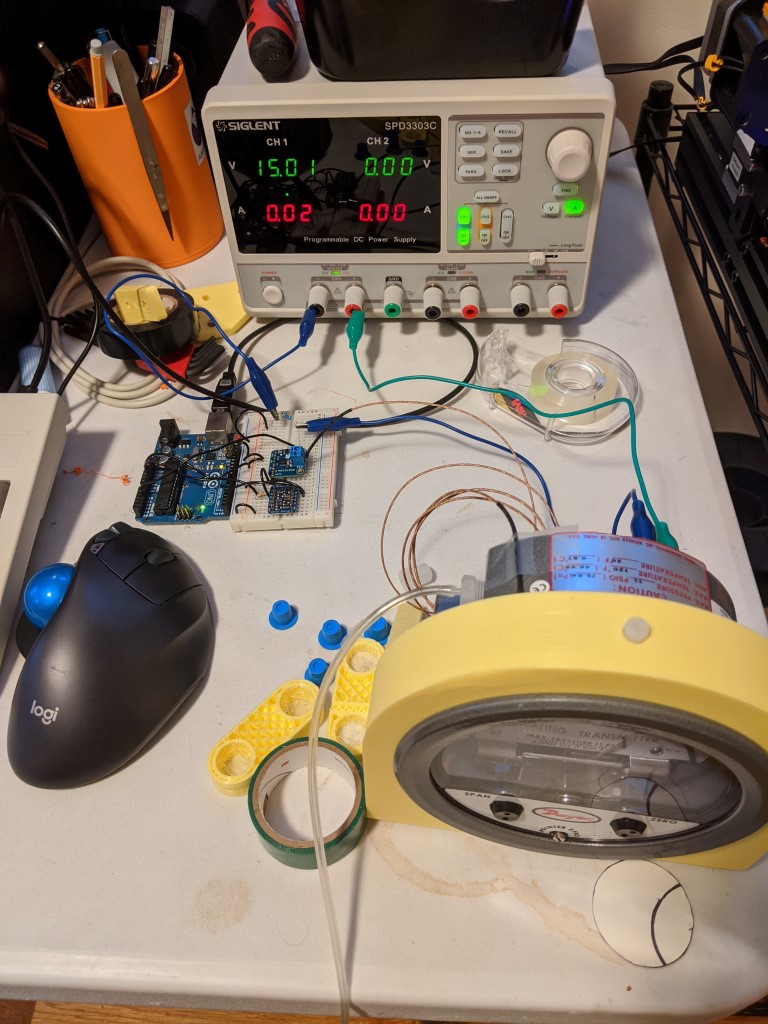
Test setup: 15V power supply, arduino , max31850, dwyer 605-20
Automated data logging is nice since it is much less tedious and usually allows for a lot more data and more data sources to be reliably sampled. In this case, I didn’t have a lot of bench space to dedicate to this, and the sampling rate was low, and I wanted to use stuff I already owned. So I ended up using an arduino as the “data collector”, a MAX31850 as the temperature sensor, and a the dwyer 605-20 as the pressure sensor.
I think the most annoying part of this is the pressure sensor- its just not really meant for this application, as its powered at a somewhat high voltage (10-35 VDC) and outputs 4-20 mA (current, not voltage) across the span of 0-20″ of water. While measuring the current is possible, and even possible to automate with some of my gear, it would take up a good amount of space, and it not really necessary.
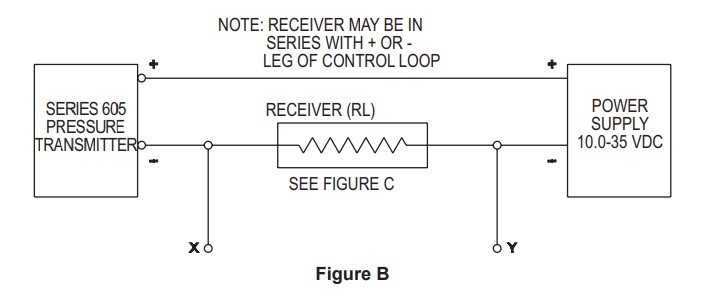
Schematic from pressure transducer datasheet. Y leg connects to arduino ground, X leg connects to Analog 0
Of course, since the pressure sensor basically becomes a current source, it is possible to stick a resistor in there to create a voltage drop. The resistor can’t be too big (requiring too much current) and making it too small will mean there is not a large enough voltage drop. I managed to find a 200 ohm resistor in my junk pile, which turned out to work well:
Output Voltage:
.02 A * 200 ohms = 4 V
.004A * 200 ohms = .8 V
Max Power Dissipation:
200 ohms * (.02 A)^2 = .08 W
According to the datasheet, 200 ohms and running at 15 V would work fine for the pressure sensor, so I had to pull out a power supply. It seems weird that I could turn the voltage up to 35V and still have the pressure sensor work fine and output the same voltage, but I guess that is the magic of it being a current source.
SAMPLE DATA
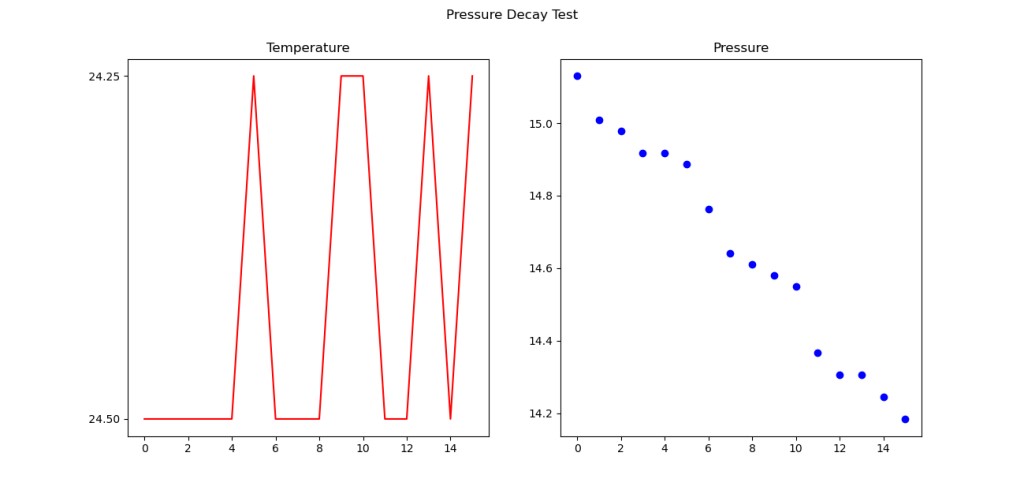
Ah, tasty data
Here we have 15 minutes of data- it was being recorded every 1 minute. As you can see, the pressure dropped about 1 inch of water over that time period, with little change in temperature. Since I have a differential pressure gauge, changes in barometric pressure should be zeroed out. So we can finally observe a leak! Given a rough volume of 13 liters (stated volume of drybag), and a nominal room temperature, it comes out to about 30 ml of gas lost over 15 minutes.
HOW GOOD IS GOOD ENOUGH?
People say that if you can measure it, you can change it. That might be true, but making something completely leak proof is more or less impossible- just keep looking and you can find a leak at some pressure or with some penetrant (like helium, a very small gas!). It’s important to know when something is good enough!
EN-14143 is a European standard for rebreathers, so lets look there for some leak rate and pressure information.
5.6.5 Exhaust valve
The apparatus shall have an exhaust valve, operated automatically by excess gas in the breathing circuit.
The exhaust valve shall prevent the pressure in the breathing circuit exceeding 40 mbar.
Testing shall be done in accordance with 6.5.3.1 after the test according to 6.5.3.2.
The operation of the exhaust valve shall not be degraded or leaking after being subjected to
a) a constant flow of 300 l min-1 for a period of 1 min;
b) a static negative pressure of 80 mbar for a period of 10 s (when in the wetted condition).
The leakage of the exhaust valve (when in the wetted condition) shall not exceed 0,5 ml (STP) min-1 when
tested with a negative pressure of 7 mbar for at least one minute.
FROM EN-14143 WHICH I FOUND SOMEWHERE ONLINE. EMPHASIS MINE
According to this, the maximum pressure the device should experience is 40mbar across the counterlung. Anything greater should be vented by the overpressure valve. Additionally, it looks like .5ml/min of leakage at 7mbar (2.8″ water) is permitted. At a higher pressure of 15″ water, it seems like the leak rate is about 2ml/min. This is encouraging since this is the leak rate for the whole system, at a much higher pressure. However, it still merits a test around 3″ of water.
Another analysis would be to consider gas supply vs leakage, since there is not a lot of gas in this rebreather. Assuming a worst case leak rate of 2ml/min, for a 30 minute dive an additional 60ml of oxygen would be lost. As a person requires somewhere around 500ml-1000ml of oxygen per minute, this seems like a very small amount to loose- less than a minute of dive time.
Overall I am surprised and pleased with the leak rate, and with an automated setup, it should be easy to take a look at this whenever I want, or across different devices and iterations. Fortunately, it looks like I might not need to do much to reduce leak rate.
COUNTERLUNG PRESSURE DECAY TESTING
The counterlung is a pretty important part of a rebreather- for the design I am pursuing, it is doubly so- not only is it a single counterlung, providing both buoyancy and breathing gas, but it houses the scrubber canister. In addition to housing the scrubber, gas addition and gas dump are located on the counterlung.
Obviously, water should be kept out of the counterlung, and gas should be prevented from escaping the counterlung. There are some qualitative tests that can be done to tell if something is leaking- spraying it with soapy water to see bubbles, or holding the counterlung underwater can show if gas is coming out. Or, the counterlung could be filled with water and I could look for water leaking out. However, both of these tests require careful observation and it is not always easy to see where the leak is coming from- for examples bubbles or water can leak from one area, get trapped, and appear to come from somewhere else. Its also hard to quantify how bad a small leak is. For a rebreather, there should be no bubbles at all.
For a more sensitive and quantitative assessment of leakage, a pressure decay test can be used. This is easier than measuring extremely low gas flow rates. The concept and execution are simple- fill the counterlung up to a pressure, and observe it the pressure goes down. This gives you an idea of how leaky something is, and its used on everything from respirator masks to space craft parts. The leak decay is much better than pressing the bag by hand, since the test can be preformed at the operating pressure of the bag. Ideally, its never more than ~20″ of water, from roughly the mask of the user to the bottom of the counterlung. Not coincidentally, 16″ of water is 40 millibar, and is the EN-14143 specification for the cracking pressure of the overpressure valve.
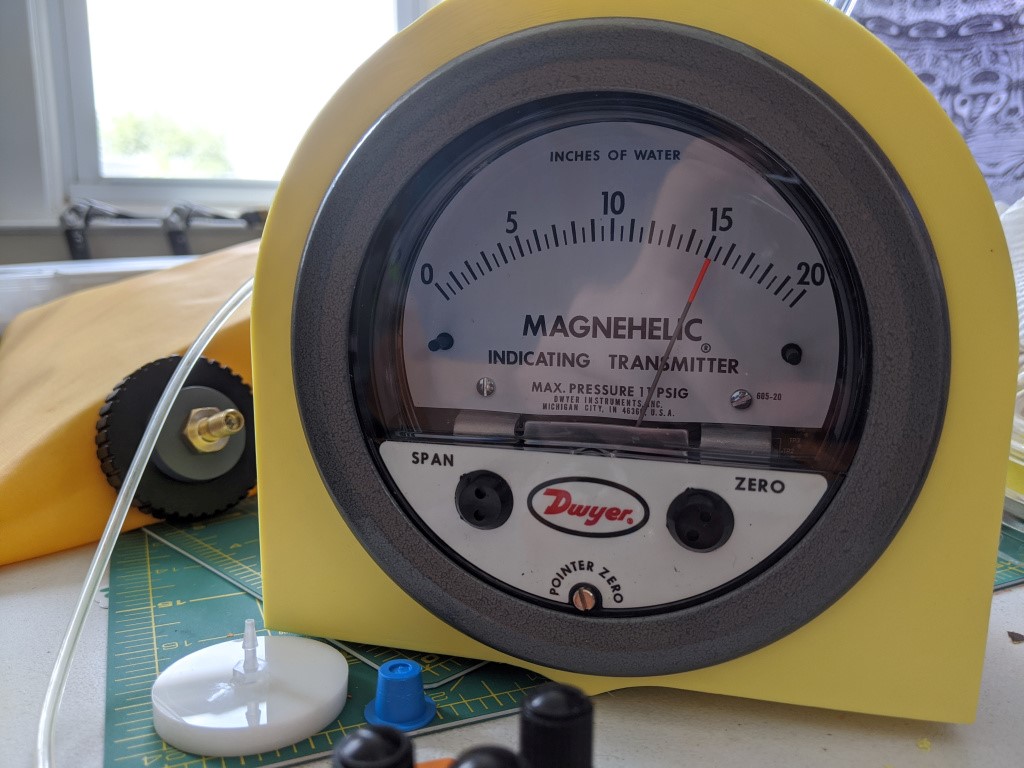
Magnahelic 650-20 Indicating transmitter, in the background is the schrader valve for adding gas and in the foreground is the gas tap plug that goes to the transmitter
Here is the pressure gauge I’m using. Its a transmitting gauge, which means at some point I’ll hook it up to some kind of data acquisition device to get some time series data, but for the moment I am just reading off the gauge face. It is also extremely sensitive- each division is .018 PSI or ~125 pascals.

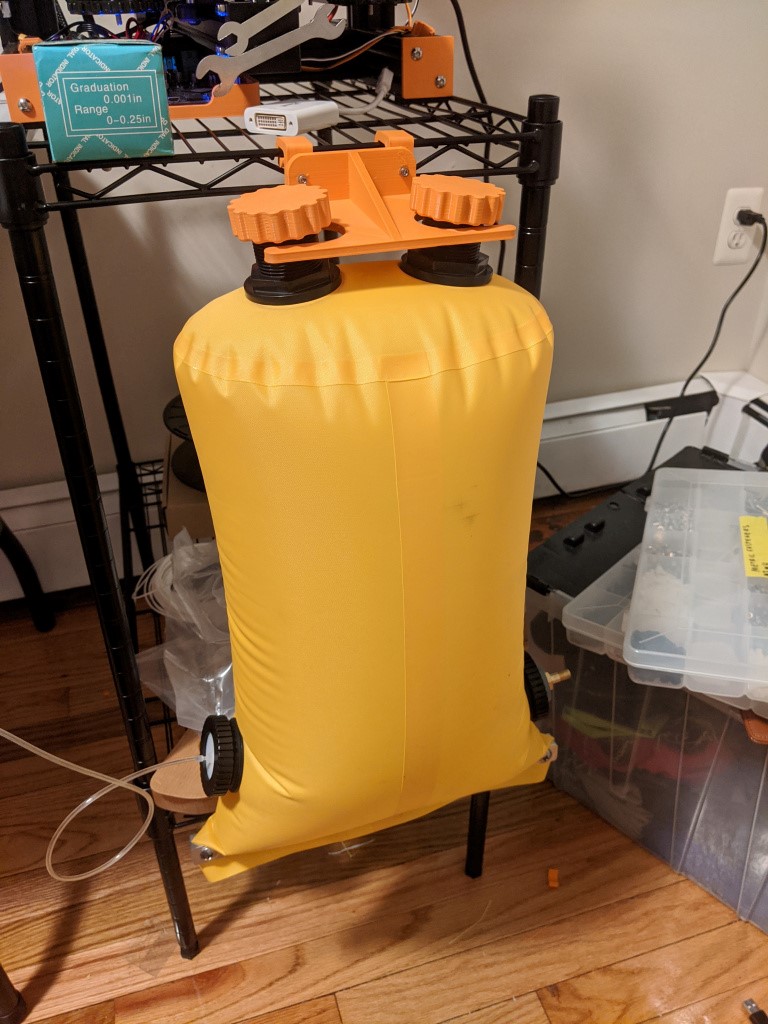
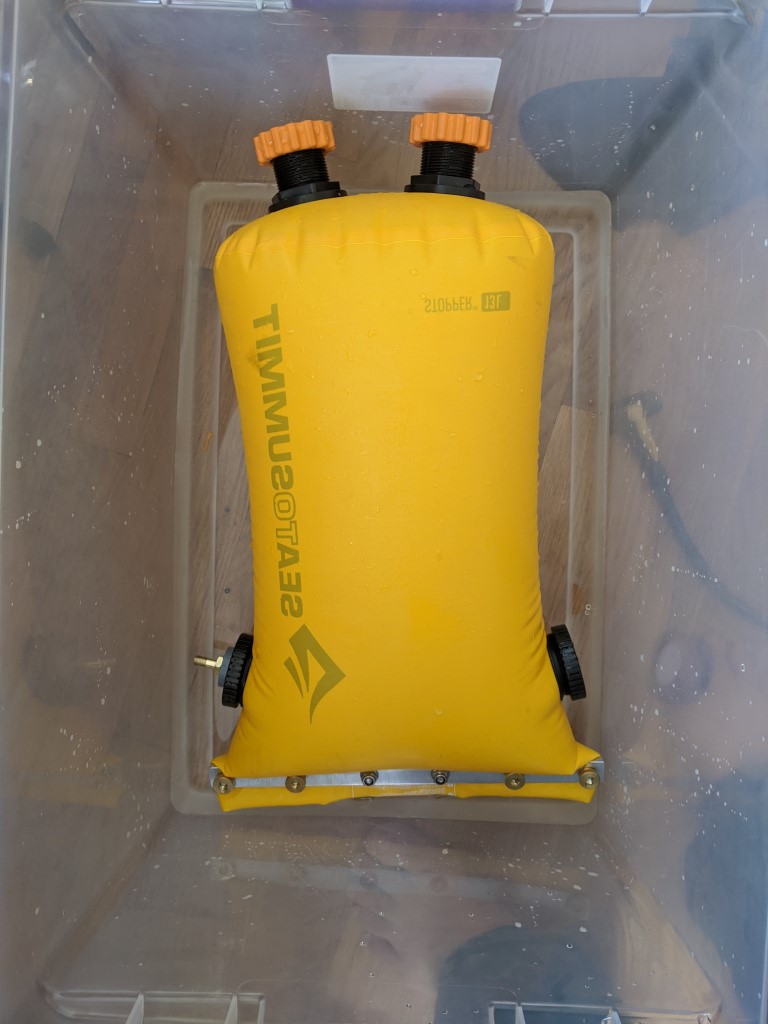
counterlung in the vertical position- metal bar is on the bottom
To give an idea of the sensitivity of the gauge, I was pleased and surprised that it can indicate a change in pressure when the sealing bar on the bottom loads the walls of the bag (by lifting the bar with my hand, it takes the weight off the fabric structure). This is important because hopefully the leak is very small and very slow.
ISSUES WITH DATA COLLECTION
There are a few issues with collecting good data. One is that temperature plays a huge role in pressure, and so a room full of windows and a struggling AC (temperature fluctuation) and storms rolling in and out (air pressure fluctuation), its hard to measure a small pressure differential. I have actually seen the pressure go up, which is the opposite of what you would expect in a leak decay test.
To resolve this, I might do one of two things- either test during a calm night when the solar effects and weather effects are minimized, or add a temperature sensor and automatic data logging to try to correct for the temperature swings.
Another annoying detail is that my hose is a hair too small, and sometimes it starts to slip off the very delicate barbs (which occasionally snap). So I may need to characterize the leak of these barb connections to make sure I don’t accidentally characterize that leak as the leak of my system, if the leak is significantly large.
PRELIMINARY RESULTS
Two important things were done- first, qualitative submersion test to look for gross leaks. A few were identified around the sealing bar, which is by far the sketchiest seal. The leak always occurred right in the middle of the bar, where the seam from the bag was. Replacing the hand-tightened nuts with nyloc nuts and cranking down with a socket solved this issue.
I also ran a few leak decay tests, which turned up the aforementioned pressure problems. However, the pressure did hold for a few hours at only seemingly a loss of a few inches of water, which seems acceptable but I think further testing will be important to do.
REGARDS, Aylo
Avery, thank you very much sharing this important reserch!

Therebreathersite was founded by Jan Willem Bech in 1999. After a diving career of many years, he decided to start technical diving in 1999. He immediately noticed that at that time there was almost no website that contained the history of closed breathing systems. The start for the website led to a huge collection that offered about 1,300 pages of information until 2019. In 2019, a fresh start was made with the website now freely available online for everyone. Therebreathersite is a source of information for divers, researchers, technicians and students. I hope you enjoy browsing the content!